b2b paid ads playbookpaid ads playbookb2b saas paid media
B2B Paid Ads Playbook: What B2B SaaS Teams Should Cover to Build Pipeline
A B2B paid ads playbook for SaaS that works backward from cost per SQL and closed-won: metrics, attribution, channels, targeting and a 90-day fix sequence.
Request a quote and our experts will contact you within 24 hours with tailored solutions and pricing.
B2B Paid Ads Playbook: What B2B SaaS Teams Should Cover to Build Pipeline
By Ads for B2B SaaS Editorial Team | Last updated: October 28, 2026
A B2B paid ads playbook is a documented operating system for B2B SaaS paid media that works backward from closed-won revenue and cost per sales-qualified lead (SQL), covering metrics, attribution, channels, targeting and a dated fix sequence. Most accounts do not run that way. Across 1,412 ad variants, click-through rate correlated with pipeline at only r=0.09 (The Paid Ads Pipeline Disconnect, GrowthSpree, June 2026), so a dashboard can look healthy while the quarter misses its number. This guide lists what a playbook must cover, in order, with the sourced numbers behind each part. For channel mechanics, the paid search guide for B2B SaaS goes deeper, and the ad account audit process covers the hands-on review.
Key Takeaways
A B2B paid ads playbook for B2B SaaS ranks every ad, campaign and channel by cost per SQL and closed-won, not by click-through rate or cost per lead.
Cost per SQL correlated with pipeline at r=0.71, against r=0.09 for CTR and r=0.23 for CPL (GrowthSpree, June 2026).
Attribution comes first: 91% of 104 audited Google Ads accounts had no GCLID-to-CRM connection (GrowthSpree, June 2026).
A 90-day fix moved average Google Ads waste rate from 34.0% to 11.0% and cut cost per SQL by 62% (GrowthSpree, June 2026).
Benchmarks are reference points, not targets: build the target from your own ACV and close rate.
What should a B2B paid ads playbook cover to build pipeline reliably?
A B2B paid ads playbook for B2B SaaS should cover six things: a pipeline-first metric hierarchy, attribution plumbing, channel selection, targeting discipline, a waste audit and a dated 90-day fix sequence. Everything works backward from cost per SQL and closed-won revenue, because cost per SQL correlated with pipeline at r=0.71 (The Paid Ads Pipeline Disconnect, GrowthSpree, June 2026), yet only 19.1% of surveyed B2B marketers track pipeline contribution (Pipeline360, 2026).
Six stacked glossy blocks of different heights arranged as a stepped ladder on a studio table
The table below maps each part of the playbook to the question it answers and the number that justifies it.
Playbook part
Question it answers
Supporting number
Metric hierarchy
Which number ranks ads and channels?
Cost per SQL r=0.71 vs CTR r=0.09 (GrowthSpree, June 2026)
Attribution setup
Can clicks be tied to SQL and closed-won?
91% of accounts had no GCLID-to-CRM link (GrowthSpree, June 2026)
Channel selection
Which channel earns the next dollar?
LinkedIn cost per SQL $800 to $8,000 by ACV tier (GrowthSpree, June 2026)
Targeting discipline
Is spend reaching the ICP?
67% of LinkedIn Ads waste came from job function, seniority and company size targeting (GrowthSpree, June 2026)
Waste audit
Where is spend leaking?
34.0% average Google Ads waste rate (GrowthSpree, June 2026)
90-day fix sequence
In what order do you repair it?
Waste rate 34.0% to 11.0% (GrowthSpree, June 2026)
Start from the formula, not the checklist
Cost per SQL is ad spend divided by the number of sales-qualified leads it produced. A target for it should come from your own economics, not a copied range. The formula is:
Maximum cost per SQL = ACV x SQL-to-closed-won rate x affordable CAC share
Start with annual contract value (ACV) for the segment you sell to.
Multiply by your SQL-to-closed-won rate to get the expected revenue of one SQL.
Multiply by the share of that revenue you can afford to spend on acquisition, your customer acquisition cost (CAC) ceiling.
Compare the result with the B2B SaaS median of $800 to $2,500 (SaaS Google Ads Benchmarks 2026, GrowthSpree, April 2026).
Illustrative example, not sourced data: an ACV of $30,000 and a 20% SQL-to-closed-won rate give $6,000 of expected revenue per SQL. If 30% of that can go to acquisition, the maximum cost per SQL is $1,800.
The lead-to-SQL step matters just as much. Divide cost per lead by the lead-to-SQL rate to get cost per SQL. Illustratively, a $200 CPL with 22% of leads reaching SQL (the inverse of the 78% that never do) is about $909 per SQL. A cheap lead is not a cheap SQL.
Why do CTR and CPL fail as B2B paid ads playbook metrics?
CTR and CPL fail as playbook metrics because they barely predict pipeline. The Paid Ads Pipeline Disconnect (GrowthSpree, June 2026) measured 1,412 ad variants across 96 accounts and $14.2M in spend: click-through rate (CTR) correlated with pipeline at r=0.09, cost per lead (CPL) at r=0.23 and cost per SQL at r=0.71.
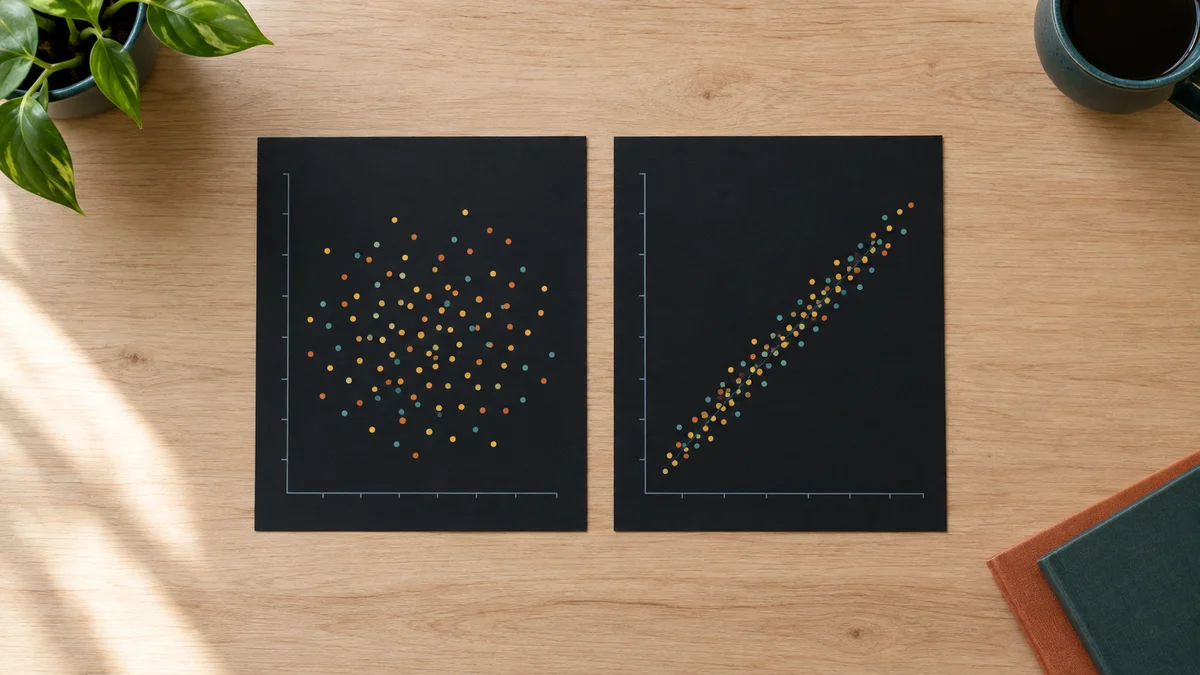
Two scatter plots on paper cards, one with a loose cloud of dots and one with dots hugging a rising line
What the correlations show
An r value of 1.0 means two measures move in lockstep. A value near zero means they are close to unrelated.
Metric
Correlation with pipeline
What it actually measures
Click-through rate (CTR)
r=0.09
Whether the ad earned a click
Cost per lead (CPL)
r=0.23
Cost of a form fill, qualified or not
Cost per SQL
r=0.71
Cost of a lead sales accepted
Source: The Paid Ads Pipeline Disconnect (GrowthSpree, June 2026), 1,412 ad variants, 96 accounts, $14.2M spend. The data is a convenience sample of audited accounts.
Sourced benchmark data: In 43% of A/B tests, the higher-CTR winner produced fewer or costlier SQLs. Re-scoring ads by cost per SQL improved cost per SQL by about 44% with no extra spend (The Paid Ads Pipeline Disconnect, GrowthSpree, June 2026).
Why teams still optimise the wrong number
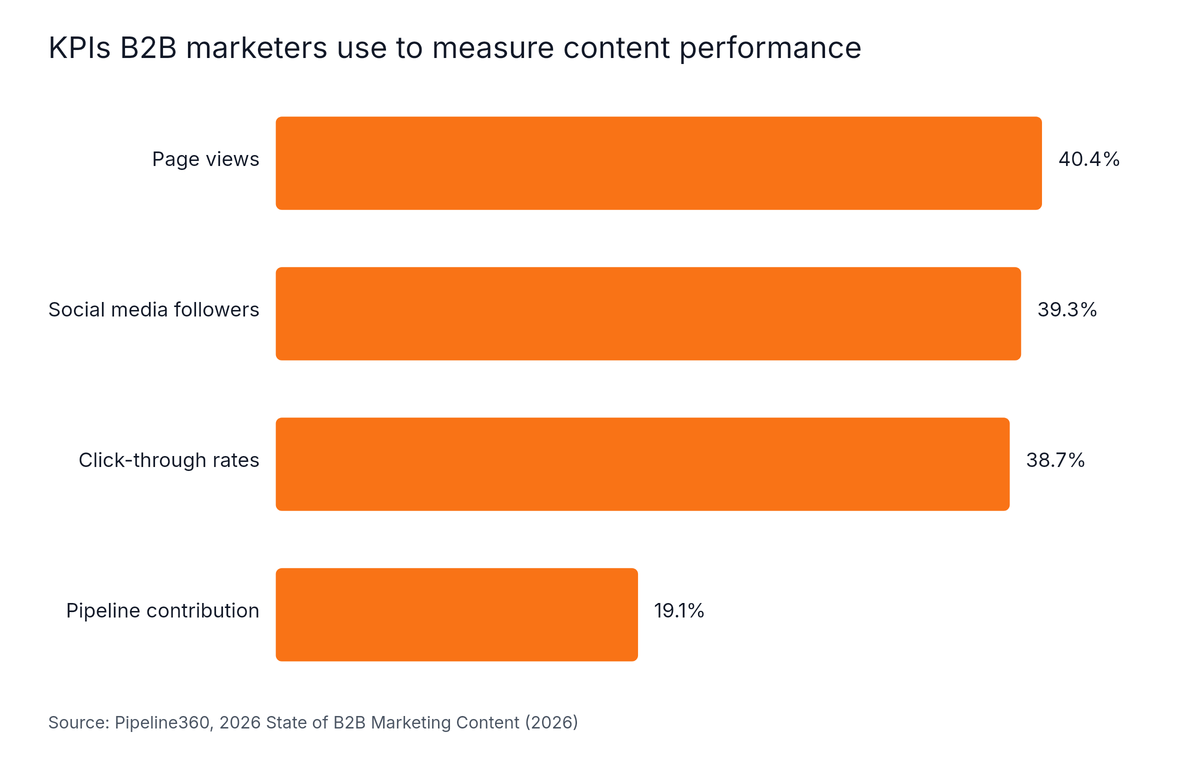
Lead volume is easy to see. Pipeline is not. In a 2026 survey of 555 B2B marketing professionals, 38.7% tracked click-through rates while 19.1% tracked pipeline contribution (Pipeline360, 2026). A separate survey found 37% use marketing-generated pipeline as a key metric, against 40% who use opens and clicks, and only 23% measure pipeline velocity (Considered Content, 2026).
Horizontal Bar chart: KPIs B2B marketers use to measure content performance. Highest: Page views at 40.4%.
CPL has a second problem. In The 2026 B2B SaaS Google Ads Waste Report (GrowthSpree, June 2026), 78% of form fills never reached SQL. Optimising on CPL pushes budget toward volume. Pausing low-CTR ads and scaling high-CTR ones does the same. The fix is a metric hierarchy: cost per SQL first, then SQL-to-closed-won rate, then CTR and CPL as diagnostics only. The ROAS guide explains where return on ad spend (ROAS) fits in that order.
How do you set up attribution so cost per SQL is measurable?
Attribution for B2B SaaS paid media means connecting each click to an SQL and closed-won deal in the CRM, then sending those stages back to the ad platforms as offline conversions. The 2026 B2B SaaS Google Ads Waste Report (GrowthSpree, June 2026) found 91% of 104 audited accounts had no Google click ID (GCLID) to CRM connection.
Why default attribution undercounts
Offline conversions are CRM outcomes, such as SQL and closed-won, imported back into an ad platform so bidding can optimise on them. Without them, automation optimises toward whatever it is fed. The same report found 89% of accounts ran default attribution before the audit, and that the default 7-day click window captures only 5% to 15% of revenue against an 84-day median sales cycle. Dreamdata's 2026 benchmark report says the average B2B journey lengthened from 211 to 272 days, with buyers spending roughly the first 220 days on self-education (Dreamdata, 2026).
The cost of running blind is visible in bidding. Performance Max (PMax) is a Google Ads campaign type that automates placements and bidding across Google inventory. Its cost per SQL was $2,140 running blind and $620 with offline conversions (GrowthSpree, June 2026). A Dreamdata co-founder put the CRM limit plainly: "CRMs aren't built to track multiple anonymous touchpoints or connect early engagement to a deal that closes months later" (Co-founder and CMO, Dreamdata, 2026).
The setup, step by step
Capture click IDs and UTMs. Store the GCLID and UTM parameters in hidden form fields on every form, under one written UTM naming standard.
Write them to the CRM. Save the values on the lead and contact record so they survive handoffs.
Sync CRM stages. Define lead, SQL, opportunity and closed-won once, and make the same definitions visible to marketing and sales.
Import offline conversions. Send SQL and closed-won events back to Google Ads and LinkedIn Ads, and bid on those events.
Add a self-reported field. A "how did you hear about us" question catches dark-funnel demand that click tracking misses.
Match the window. Set attribution windows and campaign evaluation periods to the real sales cycle, not the 7-day default.
Teams that complete this work behave differently. In an Anteriad 2026 survey, only 18% of B2B marketers had full attribution visibility, and 64% of them frequently reallocated spend, against 36% of all marketers (Anteriad, 2026). The sample size was not shown in the excerpt reviewed, so read it as directional.
How do you choose channels, budgets and targeting for B2B SaaS paid media?
Channel selection for B2B SaaS paid media should follow ACV, sales cycle and audience size, not 30-day dashboards. Google Ads captures in-market demand, while LinkedIn Ads reaches buying committees by job title. Dreamdata's 2026 report found LinkedIn ROAS rose to 121% while Google Search fell to 67%, so judge channels on revenue windows that match a 272-day journey (Demand Gen Report, 2026).
A donut shaped chart cut from layered coloured paper in four segments of different sizes
What good benchmarks look like
Use these numbers to check whether an account is in a normal range, then set the real target with the formula above.
Benchmark
Value
Source and sample
Median B2B SaaS non-brand CPC
$8.50 to $14.00
SaaS Google Ads Benchmarks 2026 (GrowthSpree, April 2026)
Median B2B SaaS cost per SQL
$800 to $2,500
SaaS Google Ads Benchmarks 2026 (GrowthSpree, April 2026)
DevTools CPC and cost per SQL
$7.50 and $650
SaaS Google Ads Benchmarks 2026 (GrowthSpree, April 2026)
Cybersecurity CPC and cost per SQL
$18.00 and $3,500
SaaS Google Ads Benchmarks 2026 (GrowthSpree, April 2026)
LinkedIn Ads CPC, B2B SaaS
$8 to $25 by vertical
Wasted LinkedIn Ads Spend in B2B SaaS (GrowthSpree, June 2026)
LinkedIn Ads cost per SQL
$800 to $8,000 by ACV tier
Wasted LinkedIn Ads Spend in B2B SaaS (GrowthSpree, June 2026)
The 42 Agency figures show CPL and CTR for reference only. They say nothing about SQL or closed-won.
Channel and budget rules
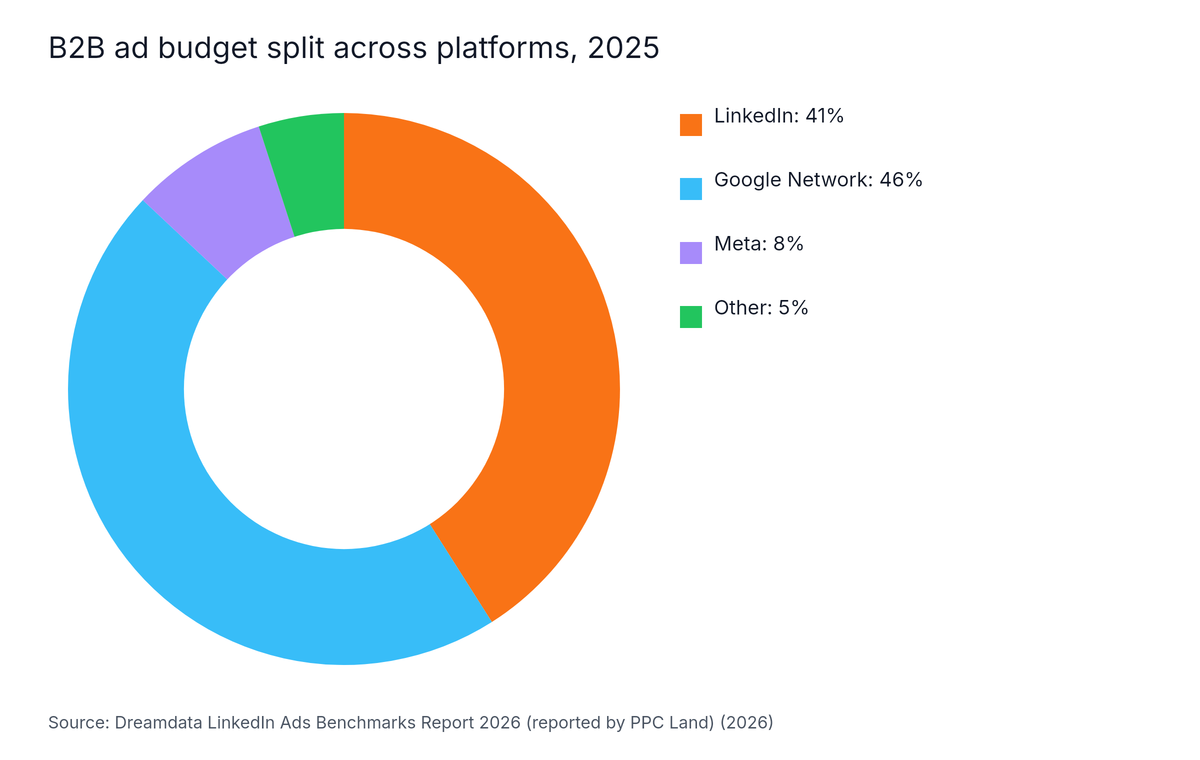
Dreamdata's LinkedIn Ads Benchmarks Report 2026 shows how B2B ad budgets were split across platforms in 2025: 46% to the Google Network, 41% to LinkedIn, 8% to Meta and 5% to other platforms (PPC Land, 2026).
Donut chart: B2B ad budget split across platforms, 2025. Highest: Google Network at 46%.
Use these rules to decide where the next dollar goes:
Start with Google Search when buyers already search for the problem and the sales cycle allows 84 days or more of measurement.
Add LinkedIn Ads when the audience is defined by job title and the ACV tier supports a cost per SQL in the $800 to $8,000 range.
Test other channels only after offline conversions are flowing, so the test can be judged on SQL.
Read lead-form CPL with care. One vendor benchmark showed LinkedIn native-form CPL of $810.83 against $221.14 for external conversions (DemandSense, 2026). The methodology was not visible, so treat it as directional and pair CPL with a quality metric.
Targeting is where waste hides. Wasted LinkedIn Ads Spend in B2B SaaS (GrowthSpree, June 2026) audited 56 accounts and $9.4M in spend: the average waste rate was 32.0%, and job function, seniority and company size targeting together accounted for 67% of it. Decision-makers received only 33% of LinkedIn budget, against a 60%+ target. Waste rate is the share of ad spend documented as wasted in an account audit.
On Google Ads, broad match without negative keywords and PMax without offline conversions together accounted for 56% of documented waste (GrowthSpree, June 2026). Practical controls:
Tier the ideal customer profile (ICP) and give the top tier the largest share of budget.
Keep exclusion lists and negative keywords current, and review search terms on a fixed schedule.
Build first-party Matched Audiences from CRM data. More than half of Dreamdata customers (55%) use LinkedIn Matched Audiences (PPC Land, 2026).
Feed sales-accepted feedback back into audience and keyword decisions.
Automation changes the settings to check. Google announced AI Max for Search out of beta on 2026-04-15, with automatically created assets and campaign-level broad match set to auto-upgrade from September 2026 (PPC Land, 2026). The Dynamic Search Ads upgrade later moved to February 2027, while the other upgrades ran in September (BrandRocket, 2026). Check search-term matching, text customisation and reporting, and keep brand exclusions and conversion values tied to pipeline.
What does a 90-day fix sequence look like for a B2B SaaS ad account?
A 90-day fix sequence for a B2B SaaS ad account runs in four phases: audit, cut waste, restructure and scale. The 2026 B2B SaaS Google Ads Waste Report (GrowthSpree, June 2026) found a 90-day fix moved average waste rate from 34.0% to 11.0% and cut cost per SQL by 62%, inside an average B2B journey of 272 days (Dreamdata, 2026).
A wall calendar with a ninety day span divided into four coloured bands from left to right
Sourced benchmark data: Across 104 accounts and $78.0M in spend, the average Google Ads waste rate was 34.0%, or roughly $255K per account per year. The best quartile wasted 13.2% and the worst quartile 49.8% (The 2026 B2B SaaS Google Ads Waste Report, GrowthSpree, June 2026).
The phase structure below is an editorial sequence, and the study does not attribute its result to any single phase.
Phase
Days
Main actions
Checkpoint
Audit
1 to 15
Map spend to CRM stages, check GCLID capture, review match types and PMax conversion inputs
Baseline waste rate and cost per SQL recorded
Cut waste
16 to 45
Add negatives, tighten job function, seniority and company size targeting, pause ads that fail on cost per SQL
Waste rate falling against baseline
Restructure
46 to 75
Import SQL and closed-won as offline conversions, rebuild campaigns around ICP tiers, set AI Max and PMax guardrails
Bidding runs on pipeline events
Scale
76 to 90
Re-score ads by cost per SQL, move budget to winners, test one new channel
Cost per SQL stable as spend grows
Re-scoring and reallocating by cost per SQL improved cost per SQL by about 44% with no extra spend (The Paid Ads Pipeline Disconnect, GrowthSpree, June 2026). That is why scaling comes last: budget moves only after the measurement is trustworthy. The wasted spend diagnosis guide walks through the first two phases in detail.
Who is this B2B paid ads playbook not for?
A B2B paid ads playbook for B2B SaaS is not for teams that want a fixed checklist or one universal benchmark. The Google Ads and LinkedIn Ads studies are convenience samples of 104 and 56 audited accounts, and only 18% of B2B marketers report full attribution visibility (Anteriad, 2026), so treat every number as a reference point, not a target.
Know these limits before adopting it:
Ecommerce and short sales cycles. The playbook assumes long cycles (84-day median), small audiences, buying committees of 6 to 10 people and CRM-based measurement.
No CRM or no SQL definition. Without agreed lead stages, cost per SQL cannot be calculated. Fix that first.
Vendor data. Dreamdata, Pipeline360, Anteriad, Considered Content, DemandSense and 42 Agency publish vendor or agency research. Some methodology and sample details were not visible, so figures are directional.
Audited accounts only. The waste rates describe accounts that were audited, which may differ from the wider market.
Platform changes. AI Max and PMax settings shift quickly, so re-check them each quarter.
Frequently Asked Questions
What goes into a paid ads playbook for B2B SaaS companies?
A paid ads playbook for B2B SaaS companies covers a pipeline-first metric hierarchy, CRM attribution with offline conversions, channel selection by ACV and sales cycle, targeting discipline, a waste audit and a dated 90-day fix sequence. It ranks every ad by cost per sales-qualified lead (SQL) and closed-won revenue, not by click-through rate or cost per lead.
What is a good cost per SQL for B2B SaaS paid ads?
The SaaS Google Ads Benchmarks 2026 report (GrowthSpree, April 2026) puts the median B2B SaaS cost per SQL at $800 to $2,500, with wide variation by vertical. DevTools averages $650 and Cybersecurity $3,500. A better target comes from your own ACV, SQL-to-closed-won rate and the share of ACV you can afford to spend.
Is CPL a useless metric for B2B SaaS?
Cost per lead is a weak guide for B2B SaaS, not a useless one. It correlated with pipeline at r=0.23 across 1,412 ad variants (GrowthSpree, June 2026), against r=0.71 for cost per SQL, and 78% of form fills never reach SQL. Keep CPL as a diagnostic, but pair it with a downstream quality metric.
How long should B2B paid campaigns run before judging pipeline results?
B2B paid campaigns should run long enough to cover the sales cycle, which has a median of 84 days for B2B SaaS (GrowthSpree, June 2026). Judging a channel after 30 days measures lead volume, not pipeline. Use leading indicators such as cost per SQL early, and judge closed-won results against your own cycle length.
What attribution window should B2B SaaS use for Google Ads?
B2B SaaS should match the Google Ads attribution window to the real sales cycle, because the default 7-day click window captures only 5% to 15% of revenue against an 84-day median cycle (GrowthSpree, June 2026). Capture the Google click ID (GCLID) in the CRM, then import SQL and closed-won stages as offline conversions.
Conclusion
A B2B paid ads playbook earns its place by tying spend to pipeline. The sourced evidence points to five takeaways:
Rank ads, campaigns and channels by cost per SQL (r=0.71), not CTR (r=0.09) or CPL (r=0.23).
Fix attribution first: capture the GCLID, sync CRM stages and import offline conversions.
Choose channels by ACV and sales cycle, and judge them over windows that match the cycle.
Control targeting and automation with ICP tiers, negatives, exclusions and AI Max and PMax guardrails.
Run the repair in a dated 90-day sequence, with a waste rate checkpoint at each phase.
The next step is to calculate your own maximum cost per SQL and compare it with your current account. For the numbers by channel, see the B2B SaaS lead generation benchmarks. To pressure-test the plan against a real account, Meet with an expert. Free consultation. Bring your ad account questions and brainstorm with a paid media expert.
Written by
Ishan Manchanda
Ishan Manchanda is co-founder of GrowthSpree, a B2B SaaS marketing consultancy founded in 2017 that has managed $60M+ in ad spend across 300+ B2B SaaS companies. He focuses on demand generation, go-to-market strategy and pipeline growth, and has been featured in Silicon Valley Times, SaaS Mag and the Unbounce podcast.
 Ishan ManchandaNov 12, 2026