Blog
Offline Conversion Tracking for B2B SaaS: How It Works and Why the Default Setup Fails
Offline conversion tracking sends CRM pipeline back to ad platforms. Learn how the GCLID loop closes, what to set up first, and why 7-day attribution fails.
Realistic LinkedIn Ads benchmarks for B2B SaaS: CPC from $8 to $25, cost per SQL from $800 to $8,000, plus CTR, CPL and video data with sources.
 Ishan ManchandaNov 10, 2026
Offline conversion tracking sends CRM pipeline back to ad platforms. Learn how the GCLID loop closes, what to set up first, and why 7-day attribution fails.
Tools to detect wasted ad spend in Google Ads, mapped to the signal each one exposes, with a triage order for B2B SaaS accounts above 30% waste.
Google Ads Performance Max for B2B: the settings, budget floor and offline conversion inputs that decide whether PMax drives SQLs or wastes spend.
Request a quote and our experts will contact you within 24 hours with tailored solutions and pricing.
Ads for B2B SaaS
Last updated: Nov 10, 2026
LinkedIn Ads benchmarks for B2B SaaS are reference ranges for CPC, CTR, CPL and cost per SQL by vertical and ACV tier, drawn from named studies with disclosed samples, so teams can judge whether their own numbers are good.
A board member asks whether a $300 lead is good or terrible. Most published LinkedIn Ads benchmarks cannot answer, because they blend B2C and B2B and stop at cost per lead (CPL). The headline ranges are $8 to $25 per click by vertical and $800 to $8,000 per sales-qualified lead (SQL) by annual contract value (ACV) tier (GrowthSpree, L26, June 2026). This guide covers cost per click (CPC), click-through rate (CTR) and CPL, then adds cost per SQL, the figure that tracks pipeline. It also covers targeting, funnel structure and video. For the wider channel decision, see the Google Ads vs LinkedIn Ads verdict.
Key Takeaways
- LinkedIn Ads CPC for B2B SaaS runs from $8 to $25 by vertical, and cost per SQL from $800 to $8,000 by ACV tier, in a 56-account, $9.4M study (GrowthSpree, L26, June 2026).
- Cost per SQL correlated with B2B SaaS pipeline at r = 0.71, while CPL reached r = 0.23 and CTR r = 0.09 (GrowthSpree, PD26, June 2026).
- Published LinkedIn CPC figures conflict because pools differ: Dreamdata reports €5.98 across all B2B customers (Dreamdata, 2026), while AgencyAnalytics reports a $8.04 median for Software & Applications (AgencyAnalytics, 2025).
- Decision-makers received only 33% of LinkedIn Ads budget in audited accounts, against a 60%+ target, and targeting choices drove 67% of waste (GrowthSpree, L26, June 2026).
- LinkedIn video and Thought Leader Ads should be judged on downstream cost per SQL, not last-click CPL.
By Ads for B2B SaaS Editorial Team, with human editor sign-off. Last updated October 28, 2026.
Realistic LinkedIn Ads benchmarks for B2B SaaS are a CPC of $8 to $25 by vertical and a cost per SQL of $800 to $8,000 by ACV tier (GrowthSpree, L26, June 2026; 56 accounts, $9.4M). Click-through rate averaged 0.96% in the best quarter (HockeyStack, 2025), and landing-page CPL averaged $221.14 (DemandSense, 2026).
Four terms carry the rest of this guide:
The table sets the main published LinkedIn Ads figures side by side, with the sample behind each.
| Metric | Figure | Source, sample and date | Scope |
|---|---|---|---|
| CPC | $8 to $25 by vertical | Wasted LinkedIn Ads Spend in B2B SaaS (GrowthSpree, June 2026): 56 accounts, $9.4M spend | B2B SaaS only |
| Cost per SQL | $800 to $8,000 by ACV tier | Same study | B2B SaaS only |
| Average CPC by quarter | $10.48 (Q1) to $15.72 (Q3) | HockeyStack, as reported by Digital Astronauts, 2026: 70+ B2B SaaS companies | B2B SaaS |
| Q3 average CTR | 0.96% | HockeyStack, 2025: 70+ B2B SaaS companies, $28M spend over three years | B2B SaaS |
| Median CPC and CTR | $8.04 and 0.52% | AgencyAnalytics, 2025 | Software & Applications, sample size not shown |
| Average CPC | €5.98 | , 2026 |
Sourced benchmark data: The Wasted LinkedIn Ads Spend in B2B SaaS study (GrowthSpree, June 2026) audited 56 accounts and $9.4M in spend. For a board asking whether a $300 lead is good, the study's $800 to $8,000 cost per SQL range is the yardstick: a $300 lead is defensible only if enough leads become SQLs to land inside the range for the account's ACV tier. The same study found an average waste rate of 32.0%.
The quarterly CPC figures reach this page through a secondary report of HockeyStack's data. Verify them against the original HockeyStack report before putting them in a board deck.
Benchmarks conflict because each publisher measures a different pool. Five causes explain most of the gap:
DemandSense states the problem directly: "The problem is not that CPL varies; it’s that these benchmark reports don’t tell you where their numbers come from." (DemandSense, 2026). ZenABM adds that "Benchmarks must be format-specific, not blended." (ZenABM, 2026).
Across 70+ B2B SaaS companies, average LinkedIn CPC was $10.48 in Q1 and $15.72 in Q3, a swing of about 50% (HockeyStack, as reported by Digital Astronauts, 2026). Q3 also had the best CTR, at 0.96% (HockeyStack, 2025). A CPC reported without its quarter is hard to use, so compare like with like before telling a board a number is high.
The LinkedIn Ads study publishes no per-vertical or per-ACV-tier rows, only the ranges of $8 to $25 per click and $800 to $8,000 per SQL (GrowthSpree, L26, June 2026). Google Ads data shows how wide vertical spread can be. The next table is Google Ads, not LinkedIn, and is a reference point only.
| Google Ads reference | Non-brand CPC | Cost per SQL |
|---|---|---|
| Median B2B SaaS | $8.50 to $14.00 | $800 to $2,500 |
| DevTools | $7.50 | $650 |
| Cybersecurity | $18.00 | $3,500 |
Source: SaaS Google Ads Benchmarks 2026 (GrowthSpree, April 2026). The sample is a single blog publication, so its methodology is limited and no account count or spend is stated. A vertical with a smaller audience and higher deal values tends to carry a higher click price and cost per SQL, and the LinkedIn range follows the same logic by ACV tier.
Divide cost per SQL by ACV to get a board-ready ratio. The numbers below are illustrative, not study data.
Illustrative rule: A team with a $30,000 ACV and a $1,500 cost per SQL pays 5% of first-year contract value for each SQL, before any SQL-to-closed-won loss. The same $1,500 against a $5,000 ACV is 30%, which is hard to defend.
Cost per SQL is the better metric to optimize in B2B SaaS paid media, including LinkedIn Ads, because it correlated with pipeline at r = 0.71, against r = 0.23 for CPL and r = 0.09 for CTR. The Paid Ads Pipeline Disconnect study covered 1,412 ad variants, 96 accounts and $14.2M in spend (GrowthSpree, PD26, June 2026).

The correlations rank the three metrics by how well each predicts pipeline:
| Metric | Correlation with pipeline | What it measures |
|---|---|---|
| CTR | r = 0.09 | Clicks per impression |
| CPL | r = 0.23 | Spend per form fill |
| Cost per SQL | r = 0.71 | Spend per sales-accepted lead |
Two further findings from the same study show the cost of optimizing on the wrong number. In 43% of A/B tests, the higher-CTR winner produced fewer or costlier SQLs. Re-scoring ads by cost per SQL improved cost per SQL by about 44% with no extra spend (GrowthSpree, PD26, June 2026).
Form fills are a weak stand-in for qualified demand. In a Google Ads audit of 104 accounts, 78% of form fills never reached SQL (GrowthSpree, G26, June 2026). HockeyStack reaches a similar view in plain words: "CTR and CPC don’t tell the full story." (HockeyStack, 2025).
Work backwards from the SQL. Target CPL equals target cost per SQL multiplied by the lead-to-SQL rate, which comes from the CRM.
Worked example (illustrative numbers, not study data): A team sets a target cost per SQL of $1,500, inside the $800 to $8,000 range. If 20% of its leads become SQLs, the target CPL is $1,500 × 0.20 = $300. A $300 lead is then good only if the CRM confirms a 20% lead-to-SQL rate. At a 10% rate, the same $300 lead implies $3,000 per SQL.
This only works when the CRM stage is connected to the ad platform. Offline conversions are CRM outcomes, such as SQLs and closed-won deals, sent back to the ad platform so bidding learns from them. The guide to PPC lead generation for B2B SaaS covers that setup, and the ROAS explainer covers return measurement.
LinkedIn Ads let B2B SaaS companies pay to reach professionals by job function, seniority and company size, and the channel holds 41% of B2B paid social budgets in Dreamdata's customer base (Dreamdata, 2026). Click prices are high and payback is slow: the average B2B buyer journey now runs 272 days, up from 211.
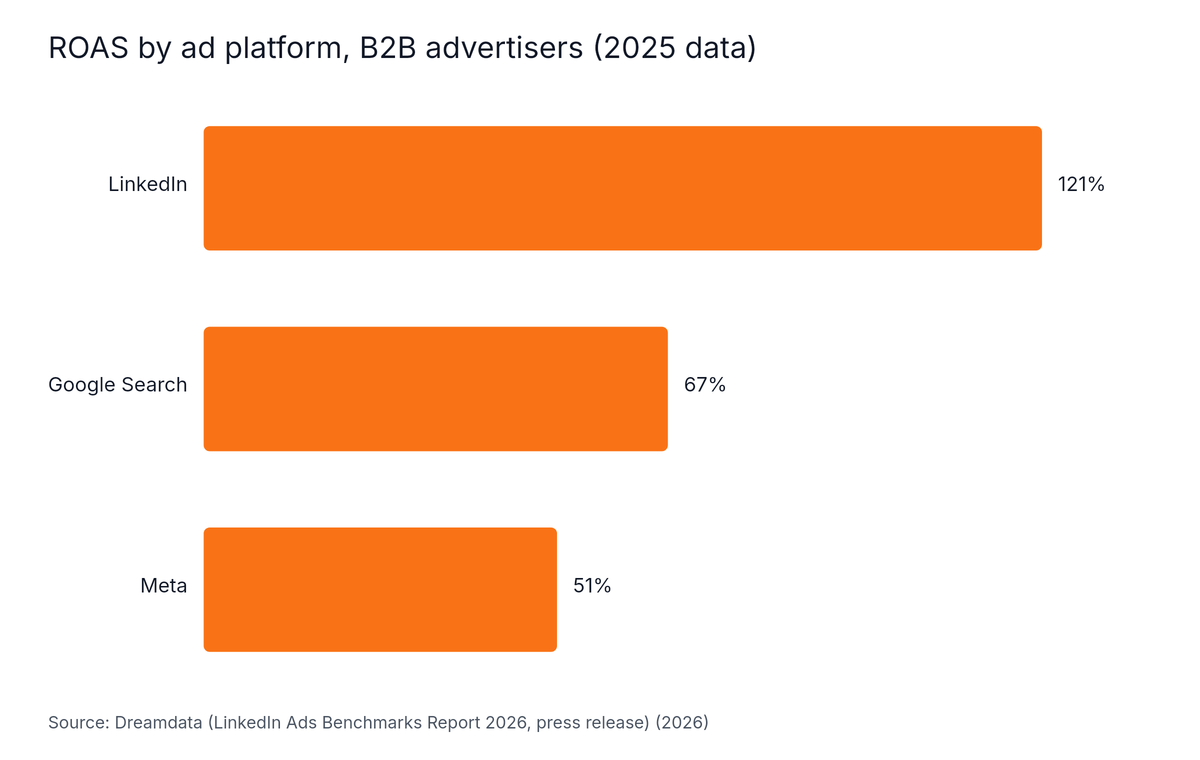
Source: Dreamdata (LinkedIn Ads Benchmarks Report 2026, press release), 2026
Return on ad spend (ROAS) is revenue attributed to ads divided by the ad spend that produced it. In Dreamdata's 2025 B2B data, LinkedIn returned 121%, against 67% for Google Search and 51% for Meta. Dreamdata's own wording: "LinkedIn is the only platform to deliver positive return on ad spend (ROAS) at 121%" (Dreamdata, 2026). The figure uses data-driven attribution on closed-won deals over 12 months. Dreamdata is a LinkedIn Marketing Partner, so read it as vendor research.
Dreamdata reports an average LinkedIn CPC of €5.98 against €1.60 on Meta (Dreamdata, 2026). Its argument is that click price misleads in B2B: "But in B2B, we close companies, not contacts." (Dreamdata, 2026).
Buyers take time before they ever talk to sales. Dreamdata finds that "buyers spend the first 220 days, roughly seven months, forming their purchasing decisions through content consumption and self-education" (Dreamdata, 2026). A one-month test judges a 272-day journey on its first few weeks. The channel and budget allocation guide explains how to size a fair test.
A B2B SaaS company should structure a LinkedIn Ads strategy around cost per SQL, an ICP-weighted audience and an evaluation window that matches the sales cycle. Decision-makers received only 33% of LinkedIn budget in audited accounts against a 60%+ target, and the average waste rate was 32.0% (GrowthSpree, L26, June 2026; 56 accounts, $9.4M spend).

The table turns that into five structural rules, each with its evidence.
| Decision | Rule | Evidence |
|---|---|---|
| Success metric | Rank campaigns and ads by cost per SQL | r = 0.71 with pipeline (GrowthSpree, PD26, June 2026) |
| Budget split | Send 60%+ of budget to decision-makers | Audited accounts averaged 33% (GrowthSpree, L26, June 2026) |
| Evaluation window | Match the window to the buyer journey | 272-day average journey (Dreamdata, 2026) |
| Measurement | Send CRM stages back as offline conversions | 78% of form fills never reached SQL in a Google Ads audit (GrowthSpree, G26, June 2026) |
| Scaling | Raise spend only after cost per SQL holds | HockeyStack caution, quoted below |
HockeyStack cautions that "Increased spend doesn't always boost performance for in-platform metrics like CTR and CPC." (HockeyStack, 2025). A budget increase should follow a stable cost per SQL, not a good CTR.
Wasted spend is ad budget that produces no qualified pipeline. The LinkedIn study found about $53,600 of wasted spend per audited account on average (GrowthSpree, L26, June 2026). Targeting by job function, seniority and company size accounted for 67% of that waste. The wasted ad spend diagnosis guide shows how to find it, and the ad account audit checklist gives the order of fixes.
Account-based targeting that covers the whole buying committee is the strongest fit for reaching ideal customer profile (ICP) buyers, because the typical B2B journey now includes 88 touchpoints and 10 stakeholders, up from 76 and 6.8 (Dreamdata, 2026). Job function, seniority and company size targeting accounted for 67% of wasted LinkedIn Ads spend (GrowthSpree, L26, June 2026).
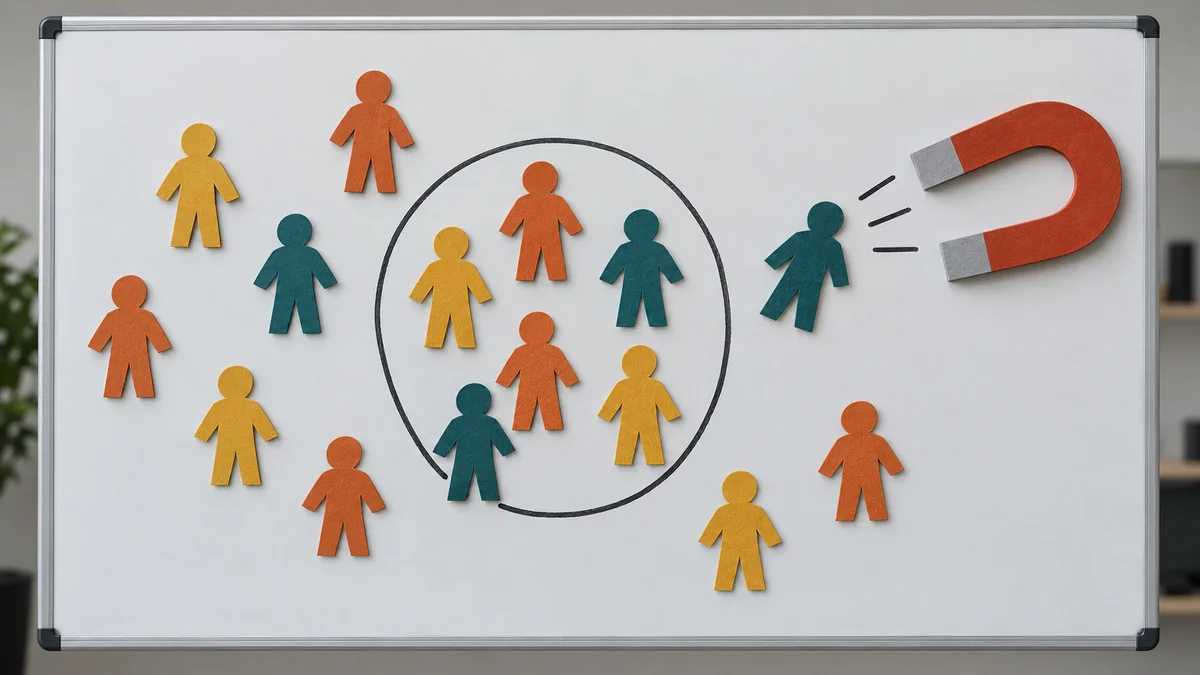
An ideal customer profile (ICP) is the description of the companies and roles most likely to buy and stay. Five targeting practices follow from the evidence:
The ZenABM sample is skewed toward account-based marketing. Thought Leader Ads are LinkedIn ads that promote posts published in an individual member's voice. Their click counts include all click types, so the CTR is not directly comparable with single-image CTR. The ad creative guide for B2B SaaS covers message and format choices.
A B2B SaaS LinkedIn Ads funnel runs from awareness content to retargeting to a conversion offer, measured by cost per SQL and judged over a window that matches a 272-day average buyer journey, up from 211 days (Dreamdata, 2026). Buyers spend the first 220 days self-educating before they enter the pipeline, so early stages should build audiences, not chase last-click leads.

Build the funnel in six steps:
Impression pricing matters at the top of this funnel. The CPM advertising guide explains when buying on it makes sense.
LinkedIn video ad best practices that improve pipeline start with creative, because 73% of video completions and 49% of video engagement rates depend on creative decisions, not budget or production value (LinkedIn Creative Labs, reported by PPC Land, 2025). Use video to build audiences and engagement, then judge it on downstream cost per SQL rather than last-click CPL.
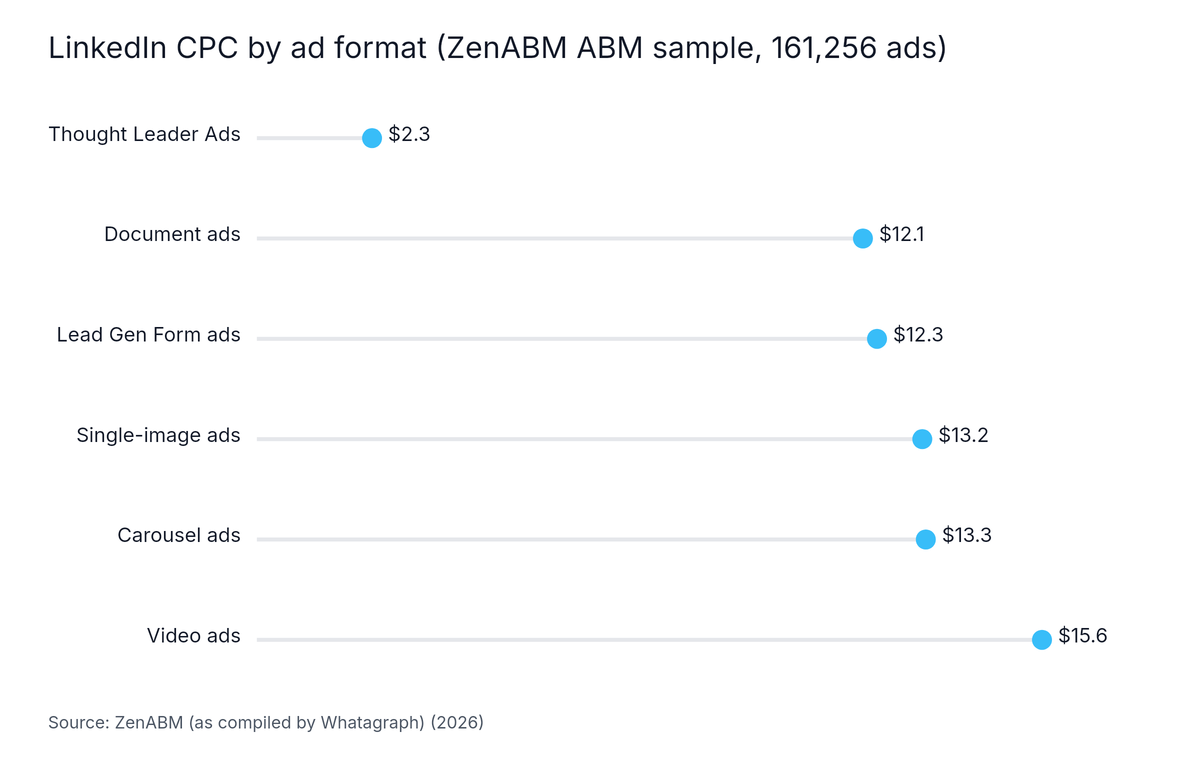
Source: ZenABM (as compiled by Whatagraph), 2026
The chart shows LinkedIn CPC by ad format in the ZenABM sample as compiled by Whatagraph: Thought Leader Ads $2.29, document ads $12.05, Lead Gen Form ads $12.33, single-image ads $13.23, carousel ads $13.30 and video ads $15.61. Video is the most expensive format per click.
Video shows the weakest click metrics of the formats ZenABM measured, across 211 B2B companies (ZenABM, 2026).
| Format | Median CPC | Median CTR |
|---|---|---|
| Video ads | $15.61 | 0.24% |
| Single-image ads | $13.23 | 0.42% |
| Thought Leader Ads | $2.29 | 2.68% |
Source for every row: ZenABM, 2026. Other publishers report different video CTRs, so treat 0.24% as one data point, not a standard. The sample skews toward account-based marketing, and no independent source ties video to cost per SQL. Click metrics alone understate what video does in a 272-day journey.
LinkedIn Creative Labs analyzed more than 13,000 B2B video ads (PPC Land, 2025). Its findings support four practices:
LinkedIn Ads benchmarks for B2B SaaS are a poor fit for B2C, ecommerce and very low-ACV products, and for teams needing a LinkedIn row per vertical. The study behind them audited 56 accounts and $9.4M in spend (GrowthSpree, L26, June 2026), and HockeyStack's 70+ company sample covers $28M over three years (HockeyStack, 2025).
Read every number with these limits in mind:
Ads for B2B SaaS states the study, sample, spend, time window and limits beside every table, so a reader can see what a number rests on.
The average LinkedIn Ads CPC for B2B SaaS in 2025 ran from $10.48 in Q1 to $15.72 in Q3 across 70+ B2B SaaS companies, as reported by Digital Astronauts from HockeyStack, 2026. Across verticals, the Wasted LinkedIn Ads Spend in B2B SaaS study reports $8 to $25 (GrowthSpree, L26, June 2026). Quote the quarter whenever you quote the number.
A good LinkedIn Ads CPC for B2B SaaS in 2025 sits inside the $8 to $25 vertical range and still produces SQLs at an acceptable cost. Software & Applications advertisers show a median CPC of $8.04, about double the $3.94 cross-industry median (AgencyAnalytics, 2025). A cheap click that never reaches SQL is a poor result.
The 2026 LinkedIn Ads CPC benchmark for B2B SaaS is $8 to $25 by vertical (GrowthSpree, L26, June 2026; 56 accounts, $9.4M spend). That study publishes the range rather than a row per vertical. For contrast, Google Ads CPCs run from $7.50 for DevTools to $18.00 for Cybersecurity (GrowthSpree, B26, April 2026).
A typical LinkedIn Ads cost per lead for B2B SaaS depends on the conversion path: DemandSense's 2026 benchmark reports $221.14 for landing-page conversions and $810.83 for native Lead Gen Forms (DemandSense, 2026), across 100+ B2B advertisers. Treat the Lead Gen Form figure as an outlier, and judge any CPL against cost per SQL.
No verified source published since late 2024 reports a 2024-specific LinkedIn Ads cost per lead for B2B SaaS. The most recent sourced figures are DemandSense's 2026 benchmark of $221.14 for landing pages and $810.83 for Lead Gen Forms (DemandSense, 2026). Compare any 2024 internal CPL with those figures and with cost per SQL.
The LinkedIn Ads click-through rate benchmark for B2B SaaS in 2025 is roughly 0.5% to 1%: HockeyStack's Q3 average was 0.96% across 70+ B2B SaaS companies (HockeyStack, 2025), and AgencyAnalytics reports a 0.52% median for Software & Applications (AgencyAnalytics, 2025). CTR correlated with pipeline at only r = 0.09 (GrowthSpree, PD26, June 2026), so use it as a diagnostic.
LinkedIn video ads for B2B SaaS show a median CTR of 0.24% and a median CPC of $15.61, the weakest click metrics of the formats ZenABM measured (ZenABM, 2026). Thought Leader Ads reached 2.68% CTR and $2.29 CPC. The sample covers 211 B2B companies and skews toward account-based marketing, so treat video as an audience-building format.
LinkedIn Ads benchmarks only help when they are tied to a named sample and to pipeline. The main takeaways:
The next step is to compare your own cost per SQL with these ranges and fix the largest source of waste first. A paid media expert can review the account with you.
Meet with an expert: Free consultation. Bring your ad account questions and brainstorm with a paid media expert.
Continue learning
Written by
Ishan Manchanda
Ishan Manchanda is co-founder of GrowthSpree, a B2B SaaS marketing consultancy founded in 2017 that has managed $60M+ in ad spend across 300+ B2B SaaS companies. He focuses on demand generation, go-to-market strategy and pipeline growth, and has been featured in Silicon Valley Times, SaaS Mag and the Unbounce podcast.
© 2026 Ads for B2B SaaS All rights reserved.


| All B2B customers, in euros |
| CPL | $221.14 landing page; $810.83 Lead Gen Form | DemandSense, 2026: 100+ B2B advertisers | SaaS, IT and professional services |