Request a quote and our experts will contact you within 24 hours with tailored solutions and pricing.
Paid Media Benchmark Report for B2B SaaS: Where the Numbers Come From and What They Cover
A paid media benchmark report for B2B SaaS is a dataset of cost per click, cost per lead and cost per sales-qualified lead (SQL) drawn from software accounts, and few published reports isolate B2B SaaS from B2C or stop short of SQLs.
The board question arrives anyway: is our cost per SQL good? A cross-industry search CPC of $5.42 (LocaliQ, 2026) says little when B2B SaaS non-brand search averages $13.75 (PipeRocket Digital, 2026). This guide maps which datasets exist, what each one sampled, and which numbers a B2B SaaS team can defend. It also points to the ad account audit process for checking your own account against them.
Key Takeaways
The median B2B SaaS non-brand Google Ads CPC is $8.50 to $14.00, and the median cost per SQL is $800 to $2,500, per GrowthSpree's SaaS Google Ads Benchmarks 2026 (April 2026).
A $5.42 cross-industry CPC and a $13.75 B2B SaaS non-brand CPC both appear in 2026 reports because the populations differ.
PipeRocket Digital's 2026 data puts B2B SaaS non-brand search at about $207 per lead against $34 for brand search, roughly a 6x gap.
Cost per SQL correlated with pipeline at r = 0.71 across 1,412 ad variants, while click-through rate correlated at r = 0.09 (GrowthSpree, The Paid Ads Pipeline Disconnect, June 2026).
Where can I find a paid media benchmark report built specifically for B2B SaaS?
No single paid media benchmark report covers B2B SaaS across every channel, so the answer is a short list of sources. PipeRocket Digital's Google Ads benchmarks (updated August 2026) are B2B SaaS-specific, 42 Agency's 2026 dataset covers B2B across 14 industries, and LocaliQ supplies the all-industry baseline. Cost per SQL data comes mainly from audit studies.
Four labelled folders fanned out on a desk beside a brass magnifying glass
The table below lists each source with its sample and window, so a reader can judge fit before using a number.
Source
Covers
Sample and window
Key limit
LocaliQ (WordStream), 2026
All industries, search
13,474 US search campaigns, April 2025 to March 2026, per a secondary tabulation
No B2B SaaS row
PipeRocket Digital, 2026
B2B SaaS Google Ads
Agency-managed accounts; one secondary source cites 65+ accounts, July 2024 to June 2026
Sample not stated consistently; verify on the page
42 Agency, 2026
B2B Google and LinkedIn
87 clients, 14 industries, $5M+ managed spend, 2022 to 2026, North America
Not B2B SaaS-only
GrowthSpree, The 2026 B2B SaaS Google Ads Waste Report (June 2026)
Waste rate, Google Ads
104 accounts, $78.0M audited
Audited accounts, not a random sample
GrowthSpree, Wasted LinkedIn Ads Spend in B2B SaaS (June 2026)
Waste rate, LinkedIn Ads
56 accounts, $9.4M audited
Audited accounts, not a random sample
GrowthSpree, The Paid Ads Pipeline Disconnect (June 2026)
CTR, CPL and cost per SQL vs pipeline
1,412 ad variants, 96 accounts, $14.2M
Audited accounts, not a random sample
A paid media benchmark report is a dataset of cost per click, cost per lead and cost per SQL drawn from many ad accounts so a team can compare its own results. A convenience sample is a set of accounts included because they were available, such as audited or agency-managed accounts, rather than chosen at random. Every dataset above is one. That is the main reason to treat each figure as a range.
What is a good CPC and cost per SQL for B2B SaaS?
The median B2B SaaS non-brand Google Ads cost per click runs $8.50 to $14.00, and the median cost per SQL runs $800 to $2,500 (GrowthSpree, SaaS Google Ads Benchmarks 2026, April 2026). The spread by vertical is wide: DevTools sits at $7.50 CPC and $650 per SQL, while Cybersecurity sits at $18.00 and $3,500.
Cost per SQL is ad spend divided by the number of leads that sales accepted as sales-qualified. It is the board-level number because it sits much closer to revenue than cost per lead.
Segment
CPC
Cost per SQL
Source
B2B SaaS median, Google Ads non-brand
$8.50 to $14.00
$800 to $2,500
GrowthSpree, April 2026
DevTools, Google Ads
$7.50
$650
GrowthSpree, April 2026
Cybersecurity, Google Ads
$18.00
$3,500
GrowthSpree, April 2026
B2B SaaS, LinkedIn Ads
$8 to $25 by vertical
$800 to $8,000 by annual contract value (ACV) tier
GrowthSpree, Wasted LinkedIn Ads Spend in B2B SaaS, June 2026
Published figures for HR Tech, FinTech, MarTech, Healthcare Tech and other verticals are thin, so those teams should use the median range and not a made-up vertical number.
What changes cost per SQL most?
Offline conversions are CRM outcomes, such as SQLs and closed-won deals, sent back to the ad platform so bidding can optimise on them. Performance Max (PMax) campaigns showed a cost per SQL of $2,140 running blind and $620 with offline conversions connected (GrowthSpree, The 2026 B2B SaaS Google Ads Waste Report, June 2026). The same study found 91% of audited accounts had no Google click ID (GCLID) connection to the CRM. See the PPC lead generation guide for what good looks like by stage.
Want a second opinion on where your account sits against these ranges? Meet with an expert. Free consultation. Bring your ad account questions and brainstorm with a paid media expert.
Why do B2B Google Ads benchmarks differ so much between reports?
B2B Google Ads benchmarks differ because each report measures a different population, window and definition of a lead. LocaliQ's 2026 report shows a $5.42 average search CPC across all industries with no B2B SaaS row, while PipeRocket Digital's 2026 data shows a $13.75 non-brand CPC for B2B SaaS. The gap reflects scope, not error.
Two measuring tapes of different lengths laid side by side on a pale surface
The cross-industry LocaliQ figure comes from 13,474 US search campaigns on Google Ads and Microsoft Ads, April 2025 to March 2026, using medians (Digital Applied, 2026). The 2026 WordStream median cost per lead is $66.69, down from $70.11 the year before. "Across all industries, cost per lead decreased overall for the first time in five years." (LocaliQ, 2026). That is a cross-industry result, so it says little about a software buyer with a long sales cycle.
42 Agency's B2B Google Search figures are a $6.29 CPC, a 0.31% conversion rate and $606 per conversion (42 Agency, 2026). The publisher says "Unlike industry surveys, this data comes directly from campaign performance reports, monthly insights, and platform APIs." (42 Agency, 2026). Its sample is 87 B2B clients across 14 industries, so it is B2B but not B2B SaaS-only, and self-managed accounts carry survivorship bias.
How can a team check whether a benchmark applies?
Run these checks before putting any number in a board deck:
Confirm the population: is it B2B SaaS, B2B broadly or all industries?
Find the sample size and the spend behind it.
Check the time window and whether it spans several years.
Identify what counts as a result: a platform conversion, a lead or a CRM-confirmed SQL.
See whether brand and non-brand search are split.
Note the geography, since nearly all published sources are US or North American.
The paid search guide covers how those inputs shape what a team should expect to pay.
How do brand search and campaign type change cost per lead?
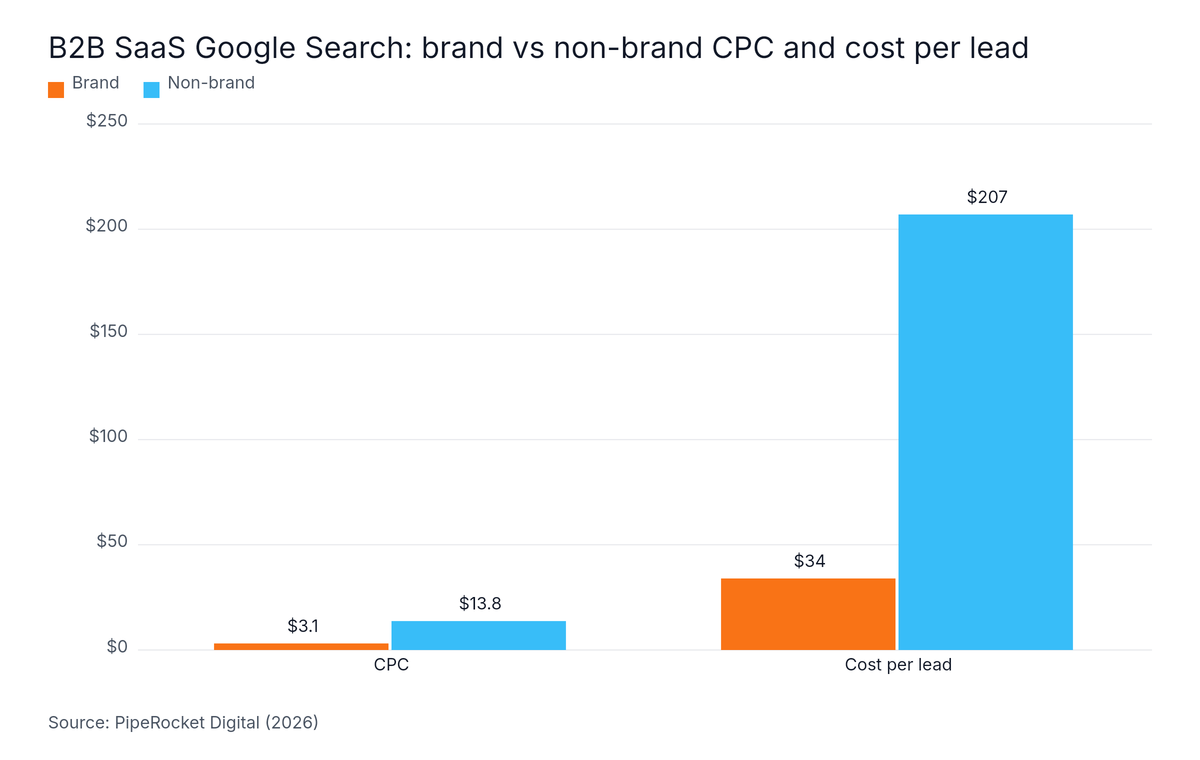
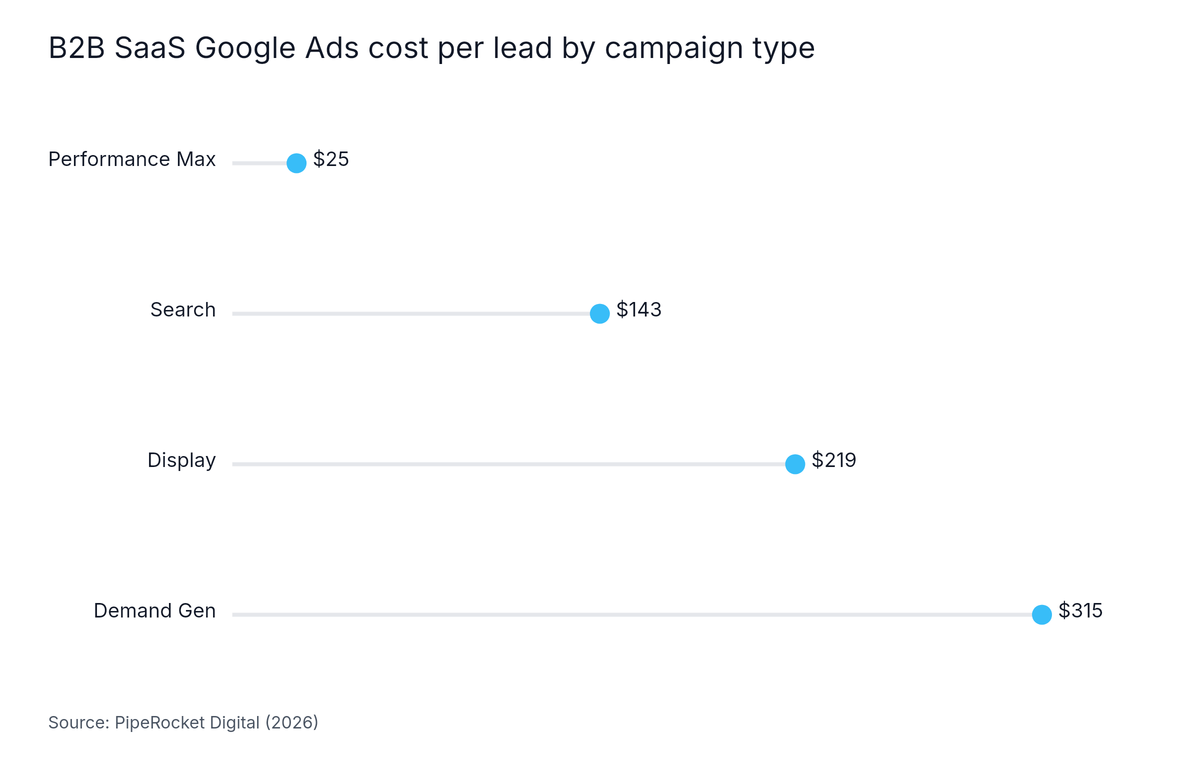
Brand search and campaign mix change blended B2B SaaS cost per lead by roughly 6x to 12x. PipeRocket Digital's 2026 data puts non-brand search at a $13.75 CPC and about $207 per lead, against $3.12 and $34 for brand search. By campaign type, cost per lead is $25 for Performance Max and $315 for Demand Gen.
Brand versus non-brand search
For B2B SaaS, non-brand Google Search averages a $13.75 CPC, a 3.94% conversion rate and about $207 per lead, while brand search averages a $3.12 CPC and $34 per lead (PipeRocket Digital, 2026). The $207 figure is about six times the $34 figure. An account with heavy brand spend will look cheaper than one built on non-brand demand.
Grouped Bar chart: B2B SaaS Google Search: brand vs non-brand CPC and cost per lead. Highest: Cost per lead at $34.
Performance Max cost per lead is $25, against $143 for Search, $219 for Display and $315 for Demand Gen (PipeRocket Digital, 2026). Demand Gen costs about 12.6 times as much per lead as Performance Max. The source itself notes that Performance Max blends in branded and lower-intent placements, so its conversions should be read as volume, not like-for-like Search leads.
Lollipop chart: B2B SaaS Google Ads cost per lead by campaign type. Highest: Demand Gen at $315.
Match type matters too. In 42 Agency's B2B data, cost per marketing-qualified lead is $1,200 for exact match, $2,800 for phrase match and $4,000+ for broad match (42 Agency, 2026).
Is the trend improving?
B2B SaaS blended cost per lead fell 36% year over year, from an average $132 to $84, while CPC was flat at -1% (PipeRocket Digital, 2026). That figure blends brand and non-brand and uses platform-reported conversions, so it is a direction, not a target. Budgets are also rising: Gartner's 2026 CMO Spend Survey puts paid media at 31.4% of marketing budgets, a five-year high, with 53% of respondents planning to invest more (Chief Marketer, 2026).
How much B2B SaaS ad spend is wasted, and which metric predicts pipeline?
The 2026 B2B SaaS Google Ads Waste Report (GrowthSpree, June 2026) puts average Google Ads waste at 34.0% across 104 accounts and $78.0M in spend. Wasted LinkedIn Ads Spend in B2B SaaS (GrowthSpree, June 2026) puts LinkedIn at 32.0% across 56 accounts. In The Paid Ads Pipeline Disconnect (GrowthSpree, June 2026), cost per SQL tracked pipeline at r = 0.71.
A glass jar of coins with a third of the coins spilled onto a table
Waste rate is the share of ad spend that an account audit classified as wasted. No independent, methodology-backed waste rate exists for B2B SaaS, so the figures here come from audit studies published in June 2026 and carry the convenience-sample caveat.
Sourced benchmark data: Google Ads waste averaged 34.0% across 104 B2B SaaS accounts and $78.0M in spend, about $255K per account per year. The best quartile wasted 13.2% and the worst 49.8%. LinkedIn Ads waste averaged 32.0% across 56 accounts and $9.4M, about $53,600 per account (GrowthSpree, The 2026 B2B SaaS Google Ads Waste Report and Wasted LinkedIn Ads Spend in B2B SaaS, June 2026).
What drives the waste?
In The 2026 B2B SaaS Google Ads Waste Report (GrowthSpree, June 2026), broad match without negative keywords and PMax without offline conversions account for 56% of Google Ads waste. In Wasted LinkedIn Ads Spend in B2B SaaS (GrowthSpree, June 2026), job function, seniority and company size targeting account for 67% of waste, and decision-makers received only 33% of budget against a 60%+ target. A 90-day fix moved average Google Ads waste from 34.0% to 11.0% and cut cost per SQL by 62%. The wasted spend diagnosis guide shows how to find these patterns.
Which metric predicts pipeline?
Metric
Correlation with pipeline
Source
Click-through rate (CTR)
r = 0.09
GrowthSpree, The Paid Ads Pipeline Disconnect, June 2026
Cost per lead (CPL)
r = 0.23
GrowthSpree, The Paid Ads Pipeline Disconnect, June 2026
Cost per SQL
r = 0.71
GrowthSpree, The Paid Ads Pipeline Disconnect, June 2026
The study covered 1,412 ad variants, 96 accounts and $14.2M in spend. In 43% of A/B tests, the higher-CTR winner produced fewer or costlier SQLs, and re-scoring ads by cost per SQL improved cost per SQL by about 44% with no extra spend.
Who should not rely on these benchmarks?
Published B2B SaaS paid media benchmarks suit teams that need a defensible range, not a fixed target. Default 7-day click attribution captures only 5% to 15% of revenue against an 84-day median sales cycle (GrowthSpree, The 2026 B2B SaaS Google Ads Waste Report, June 2026), so platform-reported leads understate pipeline. Most sources are US agency-managed convenience samples, so check each figure against your own CRM data.
Brass calipers measuring a small block with a hairline gap visible
Plain-word limits:
Geography: nearly every source is US or North American. No credible UK, European or India B2B SaaS benchmark appeared in this review.
Vertical depth: vertical figures are directional and rest on one publisher's data.
Lead definitions: platform-reported conversions are not CRM-confirmed SQLs, and 78% of form fills never reach SQL (GrowthSpree, The 2026 B2B SaaS Google Ads Waste Report, June 2026).
Attribution mixing: Dreamdata's 2026 LinkedIn Benchmarks Report shows LinkedIn ROAS of 121% against 67% for Google Search and 51% for Meta, using a 12-month closed-won window (Dreamdata via WebDisclosure, 2026). A return on ad spend (ROAS) number built on that window cannot be compared with a platform-reported lead metric. The ROAS guide explains the difference.
Frequently Asked Questions
What is a good CPC for B2B SaaS Google Ads?
The SaaS Google Ads Benchmarks 2026 report (GrowthSpree, April 2026) puts the median B2B SaaS non-brand cost per click at $8.50 to $14.00. DevTools is at the lower end at $7.50; Cybersecurity at the higher end at $18.00. CPCs vary significantly by vertical, match type and campaign structure.
What is a good cost per SQL for B2B SaaS Google Ads?
The SaaS Google Ads Benchmarks 2026 report (GrowthSpree, April 2026) puts the median B2B SaaS cost per SQL at $800 to $2,500, with wide variation by vertical. DevTools accounts average $650 per SQL; Cybersecurity accounts average $3,500. Performance Max accounts with offline conversions reached $620 versus $2,140 running blind.
Does CTR predict pipeline for B2B SaaS?
The Paid Ads Pipeline Disconnect study (GrowthSpree, 1,412 ad variants, 96 accounts, $14.2M spend) found click-through rate correlated with pipeline at r = 0.09, close to no relationship. Cost per SQL correlated at r = 0.71. In 43% of A/B tests, the higher-CTR ad produced fewer or costlier sales-qualified leads.
Do LocaliQ and WordStream benchmarks apply to B2B SaaS?
LocaliQ (WordStream) benchmarks apply only loosely to B2B SaaS. The 2026 report shows a $5.42 average search CPC across 23 industries and has no B2B SaaS row, while B2B SaaS non-brand search averages $13.75 in PipeRocket Digital's 2026 data. Use the LocaliQ figure as a cross-industry baseline, not a target.
Conclusion
A usable B2B SaaS benchmark comes with its sample, spend, window and lead definition attached. The points to carry into a board conversation:
Use $8.50 to $14.00 for non-brand CPC and $800 to $2,500 for cost per SQL as starting ranges, then adjust for vertical.
Never compare a $5.42 cross-industry CPC with a B2B SaaS account.
Split brand from non-brand and Performance Max from Search before judging cost per lead.
Rank ads and campaigns by cost per SQL, not CTR or cost per lead.
By the Ads for B2B SaaS Editorial Team. Last updated October 28, 2026.
Written by
Ishan Manchanda
Ishan Manchanda is co-founder of GrowthSpree, a B2B SaaS marketing consultancy founded in 2017 that has managed $60M+ in ad spend across 300+ B2B SaaS companies. He focuses on demand generation, go-to-market strategy and pipeline growth, and has been featured in Silicon Valley Times, SaaS Mag and the Unbounce podcast.
GrowthSpree, SaaS Google Ads Benchmarks 2026 (April 2026)
 Ishan ManchandaNov 14, 2026