Request a quote and our experts will contact you within 24 hours with tailored solutions and pricing.
Paid social vs LinkedIn Ads for B2B SaaS is a choice between cheap broad reach and costlier access to buying committees, decided mainly by annual contract value (ACV) and sales cycle length. Many teams run a 30-day test on one channel, see high costs or thin lead volume, and quit. That is a coin flip, not a decision. This Comparison sets Meta Ads against LinkedIn Ads on cost, committee reach and pipeline, then ends with a choose-X-when rule by deal size. The quantified data covers Meta Ads only; programmatic display, Reddit Ads and YouTube Ads are discussed but not benchmarked. It builds on the Google Ads vs LinkedIn Ads verdict, which covers the search half of the channel decision.
By Ads for B2B SaaS Editorial Team. Last updated: October 28, 2026. Sources are named studies published within the last two years, with sample, spend and date stated beside each figure (see the Methodology page). Reviewed by a human editor before publication.
Key Takeaways
LinkedIn Ads returned 121% return on ad spend (ROAS) against 51% for Meta Ads in Dreamdata's 2026 benchmark (Dreamdata, 2026), so LinkedIn wins on pipeline per dollar for B2B SaaS.
Meta Ads wins on click cost: EUR 1.60 per click against EUR 5.98 on LinkedIn Ads (Dreamdata, 2026).
B2B purchases involve an average of 13 internal stakeholders plus nine external participants (Forrester, 2026), so title-level targeting matters for enterprise deals.
The ACV rule is an illustrative model, assuming a 20% SQL-to-closed-won rate and acquisition cost capped at one-third of first-year ACV. An $8,000 cost per SQL becomes $40,000 per deal ($8,000 / 20%), and times three gives $120K ACV. An $800 cost per SQL gives $4,000 per deal, and times three gives $12K.
Under that model, choose LinkedIn Ads first above $120K ACV, run both from $12K to $120K, and choose broad paid social below $12K. Replace the assumptions with CRM data.
How does broad paid social compare to LinkedIn Ads for generating B2B SaaS sales-qualified leads?
Broad paid social (Meta Ads and programmatic display) buys cheap reach, while LinkedIn Ads buys access to B2B SaaS buying committees by job title and seniority. In Dreamdata's 2026 benchmark, LinkedIn returned 121% return on ad spend (ROAS) against 51% for Meta (Dreamdata, 2026). Choose LinkedIn for high annual contract value (ACV) deals; use paid social for reach and retargeting.
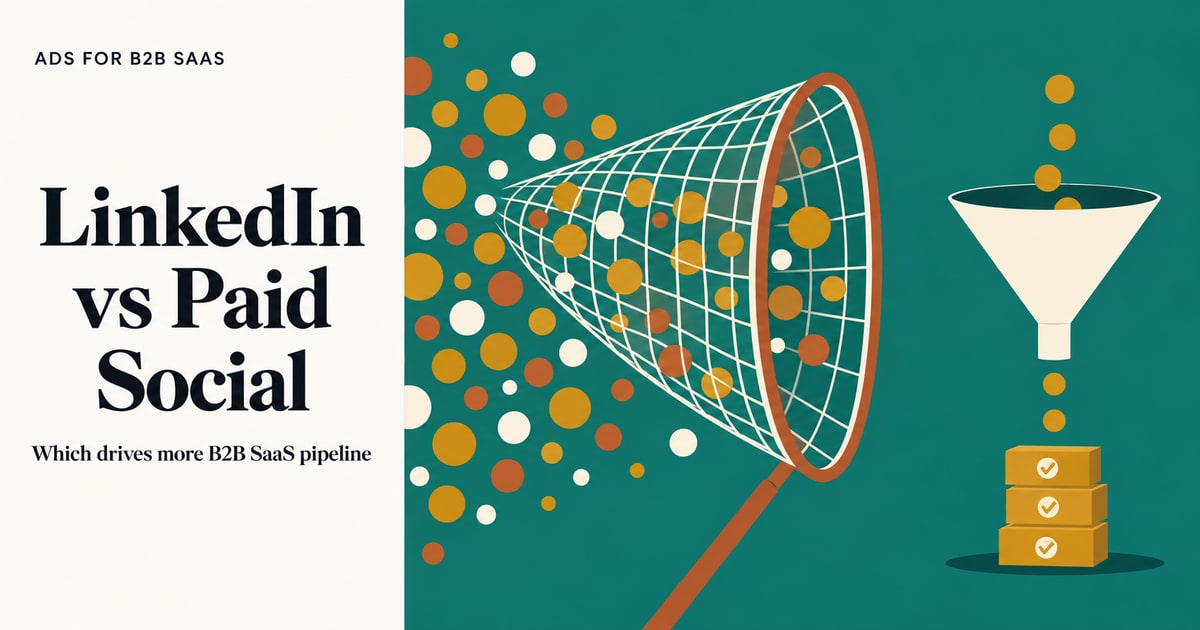
A wide net and a narrow funnel drawn as flat shapes side by side over a teal field
Paid social is advertising bought on social platforms such as Meta Ads, often paired with programmatic display, that reaches large audiences at a low cost per click. A sales-qualified lead (SQL) is a lead that sales has accepted as a real opportunity. The table sets the two channels side by side, using Dreamdata's 2025 data.
Factor
Broad paid social (Meta Ads)
LinkedIn Ads
Winner
Cost per click
EUR 1.60
EUR 5.98
Paid social
Cost per company influenced
EUR 128.70
EUR 70.11
LinkedIn Ads
ROAS, all customers
51%
121%
LinkedIn Ads
Buying committee targeting
Interest and behavior signals
Job function, seniority, company
LinkedIn Ads
Reach and retargeting
Large, cheap
Narrower, pricier
Paid social
Source: Dreamdata, 2026 report on 2025 data. The targeting and reach rows are editorial judgments, not measured values.
Which costs less for B2B SaaS: paid social or LinkedIn Ads?
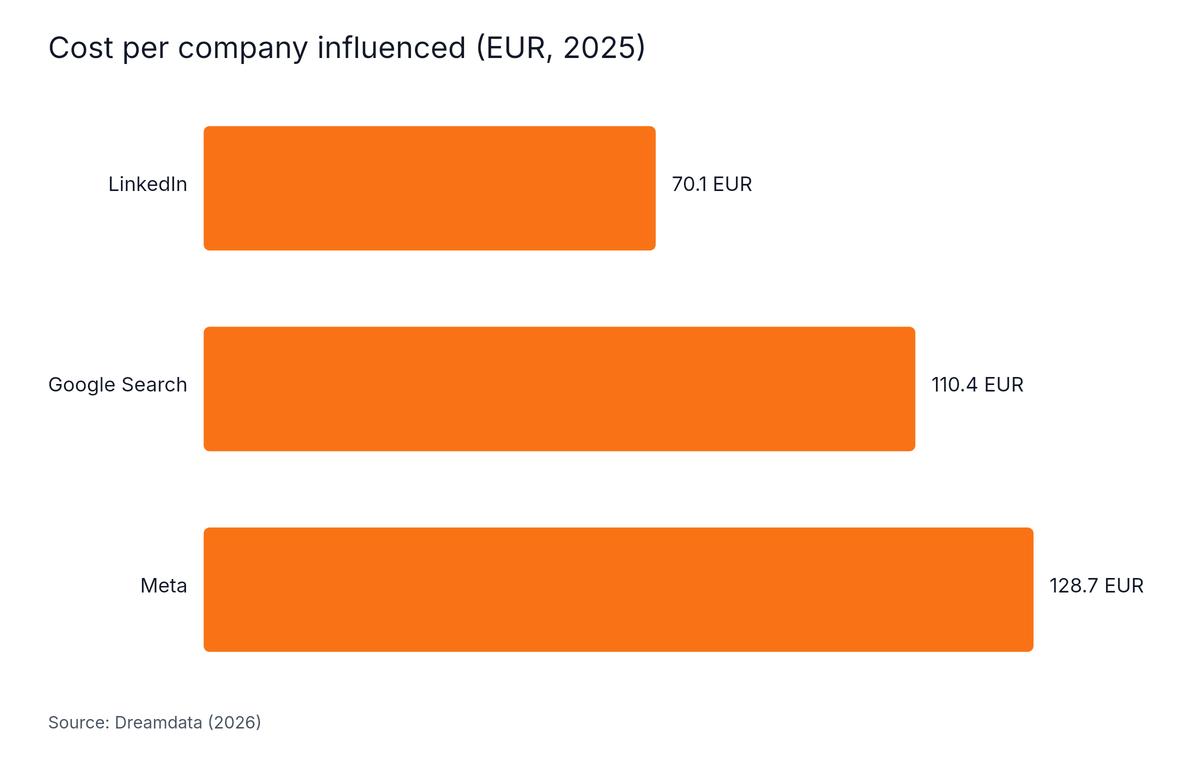
LinkedIn Ads costs more per click but less per company reached. Dreamdata's 2026 benchmark puts LinkedIn at EUR 5.98 per click against EUR 1.60 for Meta, yet LinkedIn cost EUR 70.11 per company influenced versus EUR 128.70 for Meta and EUR 110.37 for Google Search (Dreamdata, 2026).
Horizontal Bar chart: Cost per company influenced (EUR, 2025). Highest: Meta at 128.7 EUR.
The click gap is the number that makes LinkedIn look expensive. Cost per click (CPC) is what an advertiser pays for one visit, and it says nothing about whether that visitor belongs to a target account. Cost per company influenced counts accounts touched, which fits a B2B SaaS deal sold to a firm rather than a person.
Two caveats apply:
Dreamdata's company-level figure fell from EUR 154 the year before, but PPC Land (2026) notes that part of the drop comes from a new company-matching method. The year-over-year comparison is not like-for-like.
A separate audit put LinkedIn CPC for B2B SaaS at $8 to $25 by vertical (Wasted LinkedIn Ads Spend in B2B SaaS, GrowthSpree, June 2026; 56 accounts, $9.4M spend). Samples and currencies differ, so use ranges, not one point.
Which channel reaches a 6-to-10-person buying committee?
LinkedIn Ads reaches B2B SaaS buying committees more reliably than broad paid social. A buying committee is the group of stakeholders who approve a B2B purchase, and Forrester's 2026 survey found an average of 13 internal stakeholders plus nine external participants (Forrester, 2026). LinkedIn filters by job function and seniority; Meta Ads and programmatic display rely mainly on interest and behavior signals.
A circle of ten geometric badges representing a buying committee with a few highlighted in gold
Forrester counts the full buying network, so its figure reads higher than the 6 to 10 people typical of B2B SaaS deals (The 2026 B2B SaaS Google Ads Waste Report, GrowthSpree, June 2026). Either way, one cheap click on one contact reaches a small slice of the group. Reaching the economic buyer, the technical evaluator and the end-user lead takes title-level targeting.
LinkedIn does not fix targeting by itself:
Sourced benchmark data: Across 56 audited LinkedIn Ads accounts and $9.4M in spend, the average waste rate was 32.0%, about $53,600 per account. Job function, seniority and company size targeting accounted for 67% of that waste, and decision-makers received only 33% of budget against a 60%+ target (Wasted LinkedIn Ads Spend in B2B SaaS, GrowthSpree, June 2026).
The tier rule later in this comparison therefore assumes tight targeting. A team that sends two-thirds of budget to non-decision-makers will not reproduce the benchmark ROAS. The winning setup defines the ideal customer profile (ICP), the target account list and the titles first, then sends most budget to decision-makers. LinkedIn's October 2026 update also cut the minimum audience for Reserved Ads from 500,000 to 100,000 members (Influent, 2026). See the ad account audit checklist for how to check targeting splits.
Which channel returns more pipeline, and how long should B2B SaaS wait to judge it?
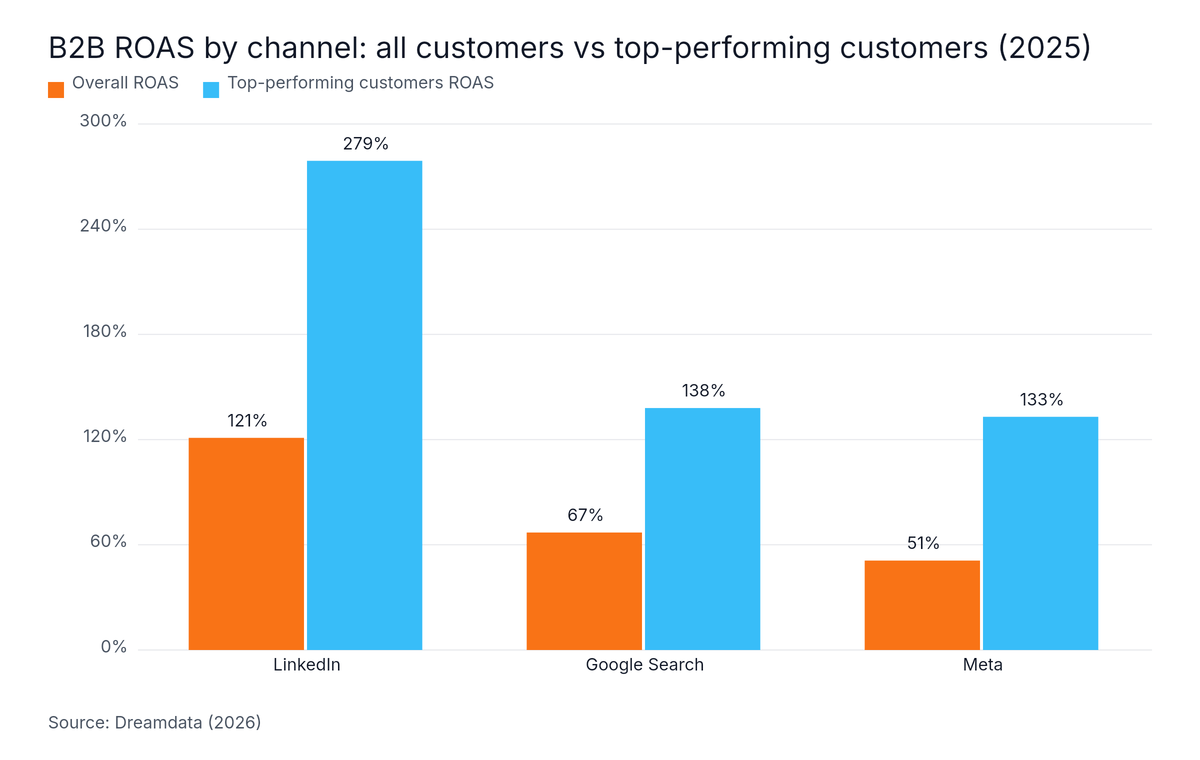
LinkedIn Ads returned more pipeline per dollar than Meta Ads in Dreamdata's 2026 benchmark: 121% ROAS against 67% for Google Search and 51% for Meta, measured on closed-won deals over 12 months (Dreamdata, 2026). B2B SaaS teams should wait at least one full sales cycle, a median of 84 days (GrowthSpree, June 2026), before judging either channel.
A long calendar-like timeline with a short highlighted segment at its start
Return on ad spend (ROAS) is revenue attributed to ads divided by ad spend. Among Dreamdata's top-performing customers, ROAS reached 279% on LinkedIn, 138% on Google Search and 133% on Meta (Dreamdata, 2026). Dreamdata calls this cohort its top-performing customers, while secondary coverage says it excludes the top 25% of outliers, so treat it as indicative. The data is account-level attribution from Dreamdata customers, so it is directional. For background, see what ROAS means for B2B SaaS.
Grouped Bar chart: B2B ROAS by channel: all customers vs top-performing customers (2025). Highest: LinkedIn at 121%.
The median B2B SaaS sales cycle is 84 days, and the default 7-day click window captures only 5% to 15% of revenue (The 2026 B2B SaaS Google Ads Waste Report, GrowthSpree, June 2026; 104 accounts, $78.0M spend). The same report found 78% of form fills never reach SQL. A one-month LinkedIn test judged on cost per lead will almost always look bad. Match the window to the journey:
Measurement window
What it captures
Source
7-day click
5% to 15% of revenue
The 2026 B2B SaaS Google Ads Waste Report (GrowthSpree, June 2026)
84 days
Median B2B SaaS sales cycle
The 2026 B2B SaaS Google Ads Waste Report (GrowthSpree, June 2026)
Dreamdata states the cost of the wrong metric plainly: "if your dashboards are still optimized around cheap clicks and cost per lead, you may be underinvesting in what drives revenue." (Dreamdata, 2026)
Sourced benchmark data: Across 1,412 ad variants, 96 accounts and $14.2M in spend, cost per SQL correlated with pipeline at r = 0.71, cost per lead at r = 0.23 and click-through rate at r = 0.09. In 43% of A/B tests, the higher-CTR winner produced fewer or costlier SQLs (The Paid Ads Pipeline Disconnect, GrowthSpree, June 2026).
Cheap Meta clicks mislead for this reason. Judge both channels on cost per SQL, which is ad spend divided by the SQLs it produced, and review closed-won by cohort. LinkedIn added campaign-level Conversion Lift Testing in June 2026 (DojoAI, 2026). It helps isolate incremental pipeline from LinkedIn against other paid social.
When should B2B SaaS choose LinkedIn Ads, and when paid social?
B2B SaaS teams should choose LinkedIn Ads when annual contract value can absorb a cost per SQL of $800 to $8,000, the range reported by Wasted LinkedIn Ads Spend in B2B SaaS (GrowthSpree, June 2026), and choose broad paid social when ACV is low, the audience is large, or the goal is retargeting. The tier cutoffs below are an illustrative editorial model.
A three-step staircase of flat blocks with a signpost at the top pointing in two directions
Annual contract value (ACV) is the yearly revenue a customer contract is worth. The model uses two stated assumptions, both hypothetical: a 20% SQL-to-closed-won rate, and acquisition cost held to one-third of first-year ACV. At 20%, an $800 cost per SQL becomes $4,000 per closed deal ($800 / 0.20) and $8,000 becomes $40,000 ($8,000 / 0.20). Multiplying by three gives the ACV each end of the range needs: $12,000 and $120,000.
ACV tier (illustrative model)
What the math says
Choose
Role of the other channel
Below $12K
Even the $800 low end of the range breaks the one-third cap
Broad paid social plus search
LinkedIn Ads only for narrow ICP tests
$12K to $120K
Fits only if cost per SQL lands in the lower part of the range
Both: LinkedIn for prospecting, Meta for retargeting
Meta stays cheap for reach
Above $120K
Even $8,000 per SQL fits the cap
LinkedIn Ads first
Meta and programmatic display for air cover and retargeting
In the middle tier, the account's own cost per SQL decides. If LinkedIn lands near $800 to $2,000, keep it. If it lands near $8,000, shift budget to retargeting. The rule also depends on targeting discipline. Audited accounts sent only 33% of LinkedIn budget to decision-makers against a 60%+ target (Wasted LinkedIn Ads Spend in B2B SaaS, GrowthSpree, June 2026), so fix that split before concluding LinkedIn is too costly for your tier. The model has no cost per SQL for Meta, because the sources do not report one.
Budget split
Among Dreamdata customers, LinkedIn took 41% of B2B paid-media budgets in 2025, up from 39% in 2024 (PPC Land, 2026). Cold prospecting on LinkedIn with retargeting on Meta is common practitioner advice, but independent data on the split is thin, so test it. For wider allocation, see ad channels and budget allocation and programmatic display platforms.
Who is this comparison not for?
The Paid Social vs LinkedIn Ads for B2B SaaS comparison is not for teams that need one universal benchmark. Dreamdata's 2026 figures come from its own customers, reported in euros with account-level attribution, and the GrowthSpree audits cited here cover 56 and 104 accounts. Treat every number as directional, and check it against your own CRM data.
Specific limits:
Meta evidence is narrow. The paid social data here is Meta only. Programmatic display, Reddit Ads and YouTube Ads are not benchmarked.
Tiers are illustrative. The $12K and $120K cutoffs come from assumed close rates and caps, so check them against CRM data.
Different counting methods. Forrester's survey of nearly 18,000 global business buyers (Forrester, 2026) counts the full buying network, so it reads higher than other firms' figures.
Very small budgets. A budget too small to collect SQL data inside one sales cycle cannot answer this test on either channel.
Self-serve products. Short, low-touch sales cycles favor broad paid social and search, not title-level targeting.
Frequently Asked Questions
Is LinkedIn Ads worth it for B2B SaaS?
LinkedIn Ads is worth it for B2B SaaS when annual contract value is high enough to absorb expensive clicks. Dreamdata's 2026 benchmark found LinkedIn returned 121% ROAS against 51% for Meta, and cost less per company influenced at EUR 70.11 versus EUR 128.70 (Dreamdata, 2026). Low-ACV products with large audiences usually fit broad paid social better.
Why is LinkedIn Ads so much more expensive than Meta Ads?
LinkedIn Ads costs more per click because advertisers pay for job title, seniority and company filters. Dreamdata's 2026 benchmark puts LinkedIn at EUR 5.98 per click against EUR 1.60 for Meta (Dreamdata, 2026). The better comparison is cost per company reached, where LinkedIn was cheaper at EUR 70.11 versus EUR 128.70.
Is retargeting on Meta cheaper than on LinkedIn?
Retargeting on Meta Ads is probably cheaper per click than on LinkedIn Ads, because Meta's overall click cost was EUR 1.60 against EUR 5.98 in Dreamdata's 2026 benchmark (Dreamdata, 2026). The cited sources do not report retargeting cost separately for either channel, so compare both on cost per SQL in your own account.
How much should B2B SaaS spend on LinkedIn Ads per month?
The cited sources give no single monthly minimum for LinkedIn Ads in B2B SaaS. A workable rule is a budget large enough to collect sales-qualified leads inside one sales cycle, which has a median of 84 days (The 2026 B2B SaaS Google Ads Waste Report, GrowthSpree, June 2026). Below that, the test cannot answer the question.
How long should B2B SaaS wait before judging LinkedIn Ads results?
B2B SaaS teams should judge LinkedIn Ads over at least one full sales cycle, not 30 days. The median B2B SaaS sales cycle is 84 days, and the default 7-day click window captures only 5% to 15% of revenue (The 2026 B2B SaaS Google Ads Waste Report, GrowthSpree, June 2026). Measure cost per SQL by cohort and add closed-won data.
At what ACV does LinkedIn Ads start to make sense for B2B SaaS?
LinkedIn Ads starts to make sense for B2B SaaS at roughly $12K in annual contract value under an illustrative model. An $800 cost per SQL at a 20% close rate is $4,000 per deal, and a one-third cap on acquisition cost multiplies that by three. The $800 comes from GrowthSpree's June 2026 LinkedIn audit; the close rate and cap are assumptions.
Conclusion
The verdict on paid social vs LinkedIn Ads for B2B SaaS is not "it depends": the rule turns on ACV. Take these points into the budget meeting:
LinkedIn Ads wins on pipeline per dollar, with 121% ROAS against 51% for Meta (Dreamdata, 2026), and on cost per company reached.
Broad paid social wins on click cost, reach and retargeting.
Buying groups of 13 internal stakeholders plus nine external participants (Forrester, 2026) need title-level targeting.
Judge both channels on cost per SQL and closed-won over a full sales cycle.
In the illustrative model, choose LinkedIn first above $120K ACV ($8,000 / 20% x 3), run both from $12K to $120K, and use paid social below $12K ($800 / 20% x 3).
For the search side of the same decision, read the Google Ads vs LinkedIn Ads verdict. Free consultation. Bring your ad account questions and brainstorm with a paid media expert: Meet with an expert.
Written by
Ishan Manchanda
Ishan Manchanda is co-founder of GrowthSpree, a B2B SaaS marketing consultancy founded in 2017 that has managed $60M+ in ad spend across 300+ B2B SaaS companies. He focuses on demand generation, go-to-market strategy and pipeline growth, and has been featured in Silicon Valley Times, SaaS Mag and the Unbounce podcast.
 Ishan ManchandaNov 12, 2026