Blog
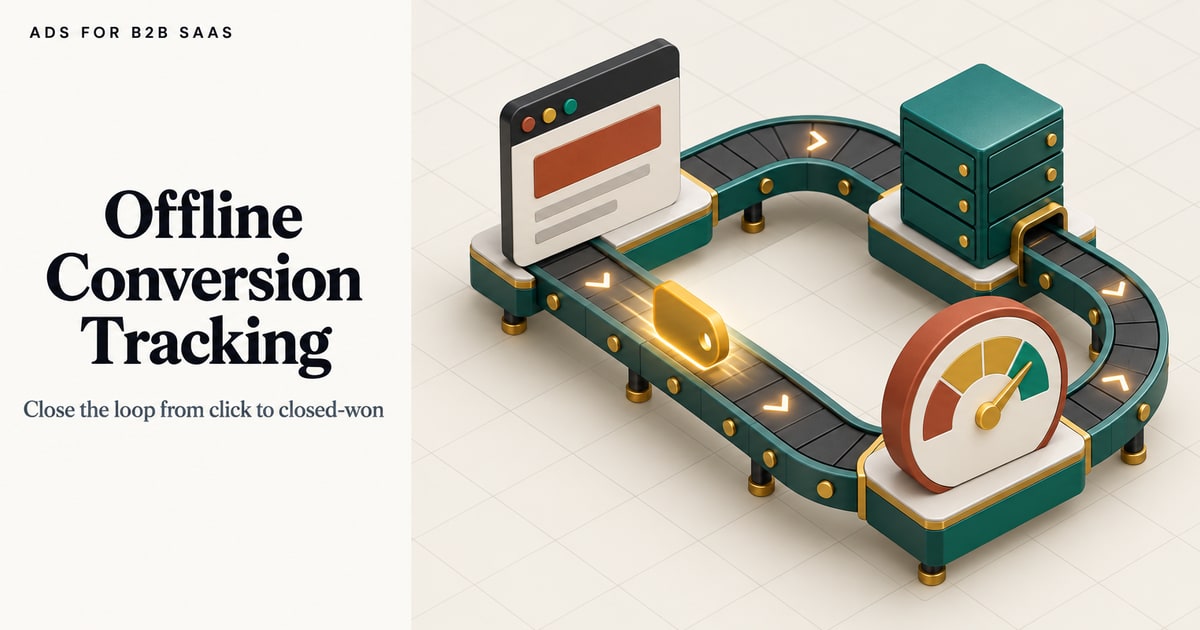
Offline Conversion Tracking for B2B SaaS: How It Works and Why the Default Setup Fails
Offline conversion tracking sends CRM pipeline back to ad platforms. Learn how the GCLID loop closes, what to set up first, and why 7-day attribution fails.
ROAS defined for B2B SaaS paid media: why the standard formula misfires on long sales cycles, and which metrics actually predict pipeline.

Offline conversion tracking sends CRM pipeline back to ad platforms. Learn how the GCLID loop closes, what to set up first, and why 7-day attribution fails.
Learn how to reduce wasted ad spend in B2B SaaS: causes, a waste rate formula, quartile benchmarks and a prioritised fix list that keeps total budget.

Why ad platform conversions and CRM pipeline never match in B2B SaaS: attribution windows, form fills that miss SQL, a GCLID audit and a fix sequence.
Request a quote and our experts will contact you within 24 hours with tailored solutions and pricing.
adsforb2bsaas.com
Last updated: Oct 21, 2026
By Ads for B2B SaaS Editorial Team | Last updated: October 13, 2026
Every figure in this guide is sourced from named studies with stated sample sizes and dates. No statistic appears without a source code. A Methodology page explaining how sources are selected is forthcoming.
Return on ad spend (ROAS) is the ratio of ad-attributed revenue to ad spend, calculated as revenue divided by spend, a metric designed for ecommerce that systematically misfires in B2B SaaS because revenue closes a median 84 days after the click.
The problem is structural. Buying committees span 6 to 10 people, and 78% of form fills never reach sales-qualified lead (SQL) status, according to the 2026 B2B SaaS Google Ads Waste Report (GrowthSpree, 104 accounts, $78.0M in spend, June 2026). A 5x return on ad spend (ROAS) printed on a platform dashboard says nothing reliable about whether a campaign is producing pipeline when most of the revenue it should count has not yet closed.
This guide defines ROAS correctly, explains precisely why it breaks down in B2B SaaS contexts, and identifies the metrics that actually correlate with pipeline. Every figure is sourced from named studies with stated sample sizes.
Key Takeaways
- Return on ad spend (ROAS) equals revenue from ads divided by ad spend. It works in ecommerce; it misfires in B2B SaaS because revenue is delayed by a median 84-day sales cycle.
- 78% of form fills never reach SQL status, so a platform-reported ROAS is built on volume that sales will never touch (GrowthSpree, G26, June 2026).
- Cost per SQL correlated with pipeline at r=0.71 across 1,412 ad variants; click-through rate (CTR) correlated at r=0.09 (GrowthSpree, PD26, June 2026).
- The median B2B SaaS cost per SQL runs $800 to $2,500, with wide variation by vertical (GrowthSpree, B26, April 2026).
- 91% of audited B2B SaaS accounts had no Google click ID (GCLID)-to-CRM connection, making any ROAS figure from those accounts structurally unreliable (GrowthSpree, G26, June 2026).
In this guide:
Return on ad spend (ROAS) is the ratio of revenue attributed to a paid media campaign to the amount spent on that campaign, expressed as a multiple. A ROAS of 5x means five dollars of attributed revenue for every dollar spent. The formula is: ROAS = Revenue from ads / Ad spend. ROAS originated in ecommerce, where a purchase follows a click within hours, making attribution clean and the metric meaningful.

The formula itself is not the problem. Given an accurate revenue figure and a complete attribution window, ROAS is a useful efficiency ratio. The difficulty in B2B SaaS is that both inputs are compromised from the start.
| Input | Ecommerce example | B2B SaaS example |
|---|---|---|
| Ad spend | $10,000 | $10,000 |
| Revenue attributed | $50,000 (purchases at checkout) | Unclear: deals close 84 days later |
| ROAS | 5x | Unmeasurable at campaign level |
| Attribution window match | Hours to days | 84-day median sales cycle |
Revenue from ads is counted at transaction. In ecommerce, that is a checkout event tracked by a pixel. In B2B SaaS, it is a closed-won deal in a customer relationship management (CRM) system, typically months after the first ad click.
Ad spend is fixed and known. The ratio's denominator is reliable. The numerator is not.
Attributed revenue is the portion of closed revenue that a measurement system connects back to a specific ad interaction. In B2B SaaS, this attribution is almost always incomplete. Buying committees involve multiple touchpoints across multiple channels. A single deal might involve a Google Ads click from one committee member, an organic search from another, and a LinkedIn Ads impression from a third. No attribution model captures all of it cleanly.
ROAS misfires for B2B SaaS paid media because the metric requires a direct, timely link between an ad click and a revenue event. That link rarely exists in B2B SaaS: the median sales cycle runs 84 days, buying committees span 6 to 10 people, and 78% of form fills never reach sales-qualified lead (SQL) status (GrowthSpree, G26, June 2026).

Three structural problems explain the misfire.
A campaign running in October produces form fills in October. Those form fills might qualify as SQLs in November and close as revenue in January. A ROAS calculation run in November sees zero revenue from that campaign. The campaign looks like it failed. Extend the window to January and the same campaign may look efficient. Which number gets reported depends entirely on when someone pulls the report, not on how the campaign actually performed.
Of all the form fills a B2B SaaS campaign generates, 78% never reach SQL status (GrowthSpree, G26, June 2026). That means the raw conversion volume the ad platform counts as the basis for any ROAS-adjacent calculation is inflated by forms that sales will not work. A high-volume, low-cost-per-click campaign can look excellent on a platform dashboard while producing almost no qualified pipeline.
B2B SaaS buying committees of 6 to 10 people (GrowthSpree, G26, June 2026) mean that the person who clicked the ad is rarely the only person who influenced the deal. A 5x ROAS figure assigns all revenue credit to one click, ignoring the other touchpoints that contributed to the decision. In practice, that attribution is a fiction.
The attribution gap in B2B SaaS paid media is the disconnect between the clicks a platform records and the revenue a business actually closes. The default 7-day click window captures only 5% to 15% of eventual revenue for accounts with an 84-day median sales cycle (GrowthSpree, G26, June 2026). Any ROAS figure pulled from the platform dashboard is built on a fraction of outcomes.

The gap has a second dimension: most accounts have never connected their ad clicks to their CRM at all. The 2026 B2B SaaS Google Ads Waste Report (GrowthSpree, June 2026) found 91% of audited accounts had no Google click ID (GCLID)-to-CRM connection, and 89% ran default attribution before the audit.
Default attribution in Google Ads uses a 7-day click, 1-day view window, applied against whatever conversion action the account has defined. For most B2B SaaS accounts, that conversion action is a form submission. The platform records the form, counts it as a conversion, and attributes a revenue value if one has been assigned.
The gap between "form submitted" and "deal closed" in B2B SaaS spans months. A default attribution window that closes after seven days captures almost none of the actual revenue events against an 84-day median cycle.
If a platform reports a ROAS of 4x on a campaign, that figure is built on:
A 4x ROAS built on these inputs does not mean the campaign produced four dollars for every dollar spent. It means the campaign produced four dollars for every dollar spent as measured by a system that structurally misses most of the revenue it should be counting.
Cost per sales-qualified lead (cost per SQL) is the metric B2B SaaS paid media teams should track alongside or instead of ROAS. A sales-qualified lead (SQL) is a lead that sales has reviewed and accepted as meeting criteria to be worked as an active opportunity. Cost per SQL connects ad spend directly to a CRM-verified pipeline event, not a platform-counted form fill.
The calculation: Cost per SQL = Total ad spend / Number of SQLs generated in the same period.
Unlike ROAS, cost per SQL does not require a completed revenue event. It requires a CRM stage event: the point at which a lead is marked as an SQL by the sales team. That event typically occurs within days to weeks of the form fill, making it a far more practical optimisation signal for teams running 84-day sales cycles.
Cost per SQL cannot be calculated from ad platform data alone. The ad platform records clicks, impressions and form fills. It does not know which of those form fills became SQLs. That classification happens in the CRM, and connecting it back to the originating ad click requires capturing the Google click ID (GCLID) as a hidden field on every form and storing it in the CRM against the lead record at the point of submission.
Without that connection, cost per SQL must be estimated from blended data: total spend divided by total SQLs in a period, with no visibility into which campaigns produced which SQLs. That blended figure is better than ROAS for strategic decisions but cannot drive campaign-level optimisation.
Sourced benchmark data (GrowthSpree, G26, June 2026): Accounts running Performance Max (PMax) with offline conversion data connected (SQLs and closed-won events imported from the CRM back into Google Ads) achieved a cost per SQL of $620, compared to $2,140 for accounts running PMax without that connection. Sample: 104 accounts, $78.0M in spend audited.
ROAS, cost per lead (CPL) and cost per SQL measure fundamentally different things in B2B SaaS paid media. The Paid Ads Pipeline Disconnect study (GrowthSpree, 1,412 ad variants, 96 accounts, $14.2M in spend, June 2026) found cost per SQL correlated with pipeline at r=0.71, CPL at r=0.23, and click-through rate (CTR) at r=0.09.

Cost per lead (CPL) is measured at the ad platform and counts all form fills, including the 78% that never become SQLs. A campaign driving high-volume, low-quality form fills at a low CPL can look excellent while producing no pipeline. CPL at r=0.23 has some relationship to pipeline, but not enough to make it a reliable optimisation target.
Click-through rate (CTR) at r=0.09 has almost no relationship to pipeline. An ad that generates high click volume can attract entirely the wrong audience: job seekers, students, competitors checking pricing, or practitioners researching without budget authority.
| Metric | What it measures | Pipeline correlation (r) | Data source |
|---|---|---|---|
| CTR | Ad engagement | 0.09 | PD26, GrowthSpree, June 2026 |
| CPL / Cost per lead | Form fill volume efficiency | 0.23 | PD26, GrowthSpree, June 2026 |
| Cost per SQL | CRM-qualified pipeline efficiency | 0.71 | PD26, GrowthSpree, June 2026 |
| ROAS | Attributed revenue efficiency | Not measured (attribution gap) | See G26 |
Sourced benchmark data (GrowthSpree, PD26, June 2026): Re-scoring ad variants by cost per SQL and reallocating budget to lower-cost SQL producers improved cost per SQL by approximately 44% with no additional spend. Sample: 96 accounts, $14.2M in spend, 1,412 ad variants.
In 43% of A/B tests across the Paid Ads Pipeline Disconnect study (GrowthSpree, June 2026), the ad variant with the higher CTR produced fewer or costlier SQLs. That means the standard A/B testing approach (pausing the lower-CTR ad and scaling the higher-CTR one) chose the worse-performing ad for pipeline in nearly half of all tested pairs. The ad that looks better on the platform is the worse choice for the business almost half the time.
B2B SaaS paid media benchmarks vary significantly by vertical and annual contract value (ACV). The SaaS Google Ads Benchmarks 2026 report (GrowthSpree, April 2026) puts the median non-brand cost per click (CPC) at $8.50 to $14.00 and the median cost per SQL at $800 to $2,500. DevTools accounts average $650 per SQL; Cybersecurity accounts average $3,500.
| Vertical | Median CPC | Median cost per SQL | Source |
|---|---|---|---|
| DevTools | $7.50 | $650 | B26, GrowthSpree, April 2026 |
| B2B SaaS median | $8.50 to $14.00 | $800 to $2,500 | B26, GrowthSpree, April 2026 |
| Cybersecurity | $18.00 | $3,500 | B26, GrowthSpree, April 2026 |
These figures are from a convenience sample. Sample sizes and limitations are stated in the source study. They are sourced benchmark data, not guarantees.
LinkedIn Ads CPCs for B2B SaaS run $8 to $25 by vertical, with cost per SQL ranging $800 to $8,000 by annual contract value (ACV) tier, according to the Wasted LinkedIn Ads Spend in B2B SaaS study (GrowthSpree, 56 accounts, $9.4M in spend, June 2026). The wide cost per SQL range reflects the difference in deal complexity across ACV tiers. High-ACV products with long sales cycles and senior buying committees will see costs toward the upper end of that range.
A cost per SQL of $900 in DevTools is above median. The same figure in Cybersecurity is well below median. Context matters. Use the vertical benchmark as the starting comparison, then compare against the account's own historical trend. A cost per SQL that is improving over time matters more than whether it sits above or below a published figure from a convenience sample.
Wasted ad spend distorts any ROAS calculation in B2B SaaS because a large portion of budget never reaches the intended audience. The 2026 B2B SaaS Google Ads Waste Report (GrowthSpree, 104 accounts, $78.0M in spend, June 2026) found an average waste rate of 34.0%, or roughly $255K per account per year, with broad match and Performance Max (PMax) without offline conversions driving 56% of that waste.
Sourced benchmark data (GrowthSpree, G26, June 2026): The best quartile of audited Google Ads accounts had a waste rate of 13.2%. The worst quartile reached 49.8%. The gap between best and worst quartile is a configuration problem, not a channel problem. A 90-day structural fix moved average waste from 34.0% to 11.0% and cut cost per SQL by 62%. Sample: 104 accounts, $78.0M in spend audited.
The ROAS implication is direct. If 34.0% of spend reaches audiences who will never become prospects, the true ROAS of the productive spend is substantially higher than the blended figure suggests. The reverse is also true: a blended ROAS figure that looks acceptable may be concealing a large inefficiency that a cleaned-up account would expose.
Broad match without negative keywords: Broad match serves ads against semantically related queries, many of which have no commercial intent for a B2B SaaS product. Without a comprehensive negative keyword list, budget disperses across consumer queries, competitor brand terms and informational searches by people with no buying authority.
Performance Max (PMax) without offline conversions: PMax optimises toward whatever conversion signal it is given. Without offline conversions connected, that signal is typically a form fill. PMax then maximises form fills, which includes the 78% that will never become SQLs. Accounts running PMax without offline conversions saw a cost per SQL of $2,140; accounts with offline conversions connected saw $620 (GrowthSpree, G26, June 2026).
On LinkedIn Ads, job function, seniority and company size targeting together account for 67% of documented waste, according to the Wasted LinkedIn Ads Spend in B2B SaaS study (GrowthSpree, June 2026). Decision-makers received only 33% of LinkedIn budget in audited accounts, against a 60% or higher target. The rest of the budget reached audiences outside the ideal customer profile (ICP): people whose job titles and seniority levels were technically within targeting parameters but who lacked purchasing authority.
ROAS remains useful in B2B SaaS paid media in specific, limited scenarios: short sales cycles under 30 days, product-led growth or self-serve purchase flows where a transaction follows the click within days, and retargeting campaigns where revenue can be tracked to a known account. Outside those conditions, ROAS works best as a quarterly blended sanity check, not a campaign-level optimisation signal.
Setting up paid media measurement for B2B SaaS pipeline requires connecting ad platform data to CRM data at the individual lead level. The 2026 B2B SaaS Google Ads Waste Report (GrowthSpree, June 2026) found 91% of audited accounts had no Google click ID (GCLID)-to-CRM connection, and 89% ran default attribution before the audit. Fixing that connection cut cost per SQL by 62% across audited accounts (GrowthSpree, G26, June 2026).

Capture the GCLID at form submission. Pass the Google click ID (GCLID) as a hidden field on every form, and store it in the CRM against the lead record at the point of submission. Without this step, there is no way to match ad clicks to CRM outcomes.
Define SQL as a conversion event. Mark the point at which a lead reaches SQL status in the CRM as the conversion event to import back to Google Ads. This is the first meaningful pipeline signal the bidding system can use.
Import offline conversions on a regular schedule. Upload SQL events from the CRM to Google Ads as offline conversions, using the GCLID to match them to the originating click. Weekly imports are the minimum cadence for a functional signal.
Adjust the attribution window to match the actual sales cycle. Switch from the default 7-day click window to a data-driven or 30-day click window, or longer if the account's data supports it. For a median 84-day sales cycle, a 7-day window captures only 5% to 15% of revenue events (GrowthSpree, G26, June 2026).
Once offline conversions are in place, the reporting structure should prioritise:
| Metric | Why it matters | How to calculate |
|---|---|---|
| Cost per SQL | Primary pipeline efficiency metric | Total spend / SQLs in period |
| SQL volume by campaign | Identifies which campaigns drive real pipeline | CRM SQL count filtered by campaign GCLID |
| Cost per closed-won | Ultimate efficiency check | Total spend / closed-won deals in period |
| Blended ROAS (quarterly) | Business-level sanity check | Total revenue / total paid media spend |
The blended quarterly ROAS belongs in board reporting as context, not in campaign optimisation decisions. Campaign decisions belong to cost per SQL, and cost per SQL belongs to the data coming out of the CRM, not the platform dashboard.
B2B SaaS teams with sales-assisted pipelines and sales cycles over 30 days are the intended audience for this guide. Teams whose product sells at checkout, converts within hours, and renews automatically at low price points will find ROAS works as a primary metric. The structural arguments here (long cycles, multi-person decisions, CRM-gated qualification) do not apply to those models.
Related guides coming soon: Ad Creative Best Practices for B2B SaaS and Why B2B SaaS Companies Use Paid Search. Internal links will be added when those guides publish.
Ready to connect ad spend to actual pipeline? Meet with a paid media expert who works exclusively in B2B SaaS. Free consultation. Bring your ad account questions and brainstorm with a paid media expert. Meet with an expert
Return on ad spend (ROAS) is the ratio of revenue generated to the amount spent on advertising, expressed as a multiple. A 5x ROAS means every dollar spent produced five dollars in revenue. ROAS is straightforward in ecommerce but becomes unreliable in B2B SaaS because revenue is delayed by a median 84-day sales cycle and measured across a buying committee of 6 to 10 people.
ROAS requires a timely revenue signal. In B2B SaaS, the median sales cycle runs 84 days, 78% of form fills never reach SQL status, and default 7-day attribution captures only 5% to 15% of revenue. The ROAS figure a platform reports in any month reflects a small, unrepresentative slice of pipeline (GrowthSpree, 2026 B2B SaaS Google Ads Waste Report, 104 accounts, $78.0M in spend, June 2026).
Cost per SQL is the most useful primary metric for B2B SaaS paid media. The Paid Ads Pipeline Disconnect study (GrowthSpree, 1,412 ad variants, June 2026) found cost per SQL correlated with pipeline at r=0.71, versus r=0.09 for CTR and r=0.23 for CPL. Re-scoring ads by cost per SQL improved that metric by approximately 44% with no additional spend.
The SaaS Google Ads Benchmarks 2026 report (GrowthSpree, April 2026) puts the median B2B SaaS cost per SQL at $800 to $2,500, with wide variation by vertical. DevTools accounts average $650 per SQL; Cybersecurity accounts average $3,500. Accounts running Performance Max with offline conversions connected achieved $620 per SQL, compared to $2,140 for accounts running without that connection. These are convenience sample figures.
The SaaS Google Ads Benchmarks 2026 report (GrowthSpree, April 2026) puts the median B2B SaaS non-brand cost per click at $8.50 to $14.00. DevTools sits at the lower end at $7.50; Cybersecurity sits at the higher end at $18.00. Cost per click varies by vertical, match type and campaign structure, so CPC alone is not a useful optimisation target without the downstream SQL cost alongside it.
Cost per lead (CPL) is measured at the ad platform and includes all form fills, of which 78% never reach SQL status. In the Paid Ads Pipeline Disconnect study (GrowthSpree, 1,412 ad variants, June 2026), CPL correlated with pipeline at r=0.23. Optimising on CPL directs budget toward volume rather than quality, the wrong trade-off when sales cycles run a median of 84 days.
The default 7-day click window captures only 5% to 15% of revenue for B2B SaaS companies with an 84-day median sales cycle (GrowthSpree, G26, June 2026). The correct setup involves capturing the GCLID in the CRM, importing SQL and closed-won data as offline conversions, and using a data-driven or longer attribution window matched to the actual sales cycle length.
The 2026 B2B SaaS Google Ads Waste Report (GrowthSpree, 104 accounts, $78.0M in spend, June 2026) found an average waste rate of 34.0%, or roughly $255K per account per year. The best quartile wasted 13.2%; the worst wasted 49.8%. Broad match without negatives and Performance Max without offline conversions account for 56% of documented waste.
Return on ad spend (ROAS) is a valid efficiency metric in contexts where revenue follows a click quickly and attribution is clean. In B2B SaaS, neither condition holds. A median 84-day sales cycle, buying committees of 6 to 10 people, and a 78% form fill-to-SQL failure rate mean that the revenue figure ROAS requires is structurally unavailable at the campaign level.
Cost per SQL, measured against CRM-verified pipeline events, is the metric that actually correlates with business outcomes in B2B SaaS paid media. The Paid Ads Pipeline Disconnect study (GrowthSpree, 1,412 ad variants, June 2026) found a correlation of r=0.71 between cost per SQL and pipeline. CTR came in at r=0.09.
The practical starting point is measurement: capture the GCLID at form submission, import SQLs and closed-won events as offline conversions, and match the attribution window to the actual sales cycle. Accounts that made that change saw cost per SQL fall from $2,140 to $620 on Performance Max alone (GrowthSpree, G26, June 2026).
Five things to take from this guide:
If the ad account is spending but SQLs are not moving, the measurement layer is the first place to fix. That is the foundation every other optimisation decision depends on.
Meet with an expert. Free consultation. Bring your ad account questions and brainstorm with a paid media expert. Book a free consultation
Sources: The 2026 B2B SaaS Google Ads Waste Report (GrowthSpree, 104 accounts, $78.0M in spend, June 2026) | Wasted LinkedIn Ads Spend in B2B SaaS (GrowthSpree, 56 accounts, $9.4M in spend, June 2026) | The Paid Ads Pipeline Disconnect (GrowthSpree, 1,412 ad variants, 96 accounts, $14.2M in spend, June 2026) | SaaS Google Ads Benchmarks 2026 (GrowthSpree, April 2026). All figures are from convenience samples. Sample sizes and study limitations are stated beside each data reference. All four source studies cited in this guide were published by GrowthSpree. No independent third-party replication studies are available as of October 2026. This page reflects data available as of October 2026 and will be updated when source studies are refreshed.
© 2026 adsforb2bsaas.com All rights reserved.